Detailed cost tracking for Claude Code sessions
Subomi Oluwalana
June 17, 2026 · 3 min read
When a Claude Code session runs against your MCP servers, the tokens add up somewhere you can’t see. A single prompt can fan out into a dozen tool calls, each one loading context, each one billing input and output tokens against your account. By the time the bill arrives, the detail is gone. You know the total, but not which prompt, which model, or which tool burned it.
Speakeasy now shows you. Every Claude Code session in your chat logs carries per-turn usage: tokens in, tokens out, cache reads, the model that actually answered, and the cost of that turn. Tool calls show how many bytes moved in and out. The breakdown sits on each message, where you’re already looking.
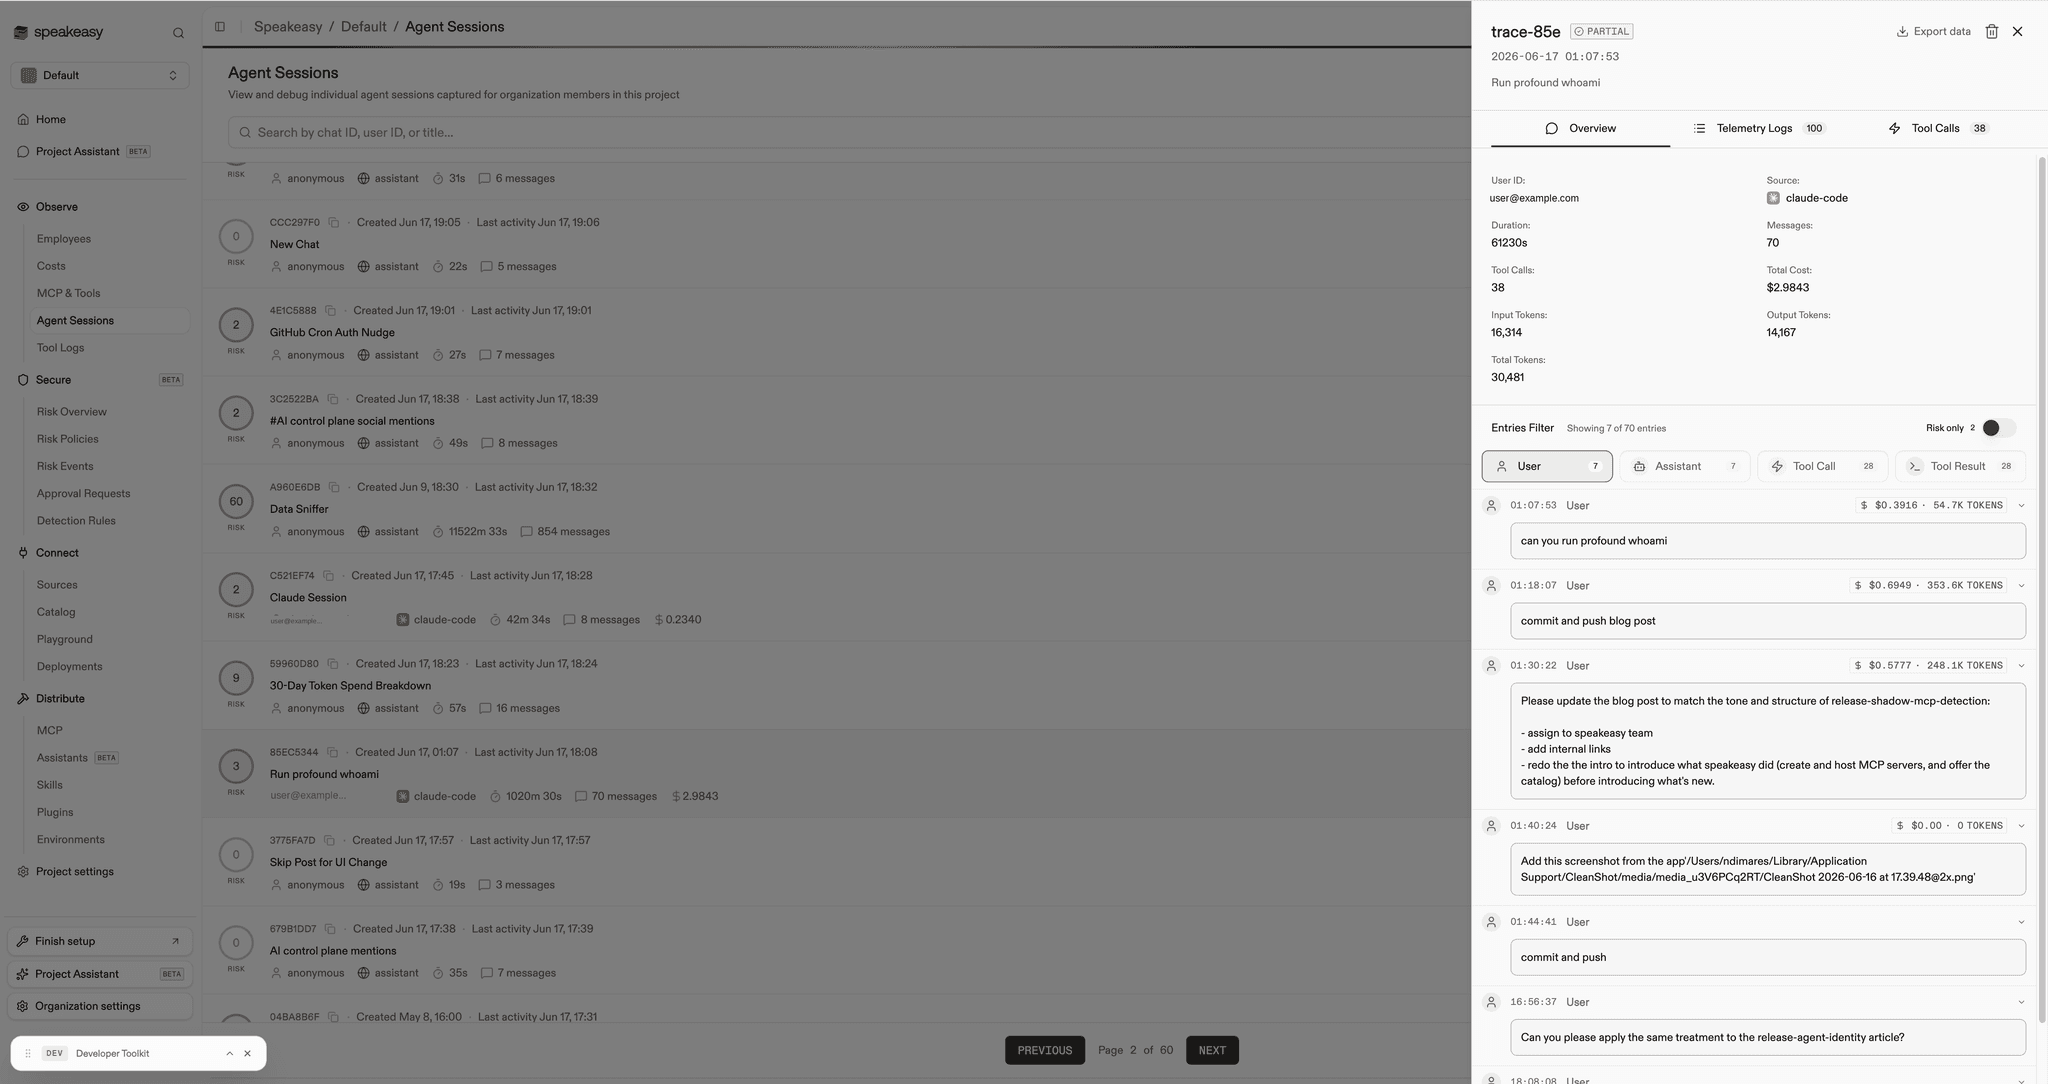
What you can see
Open any Claude session in the logs view. Each user message now carries a usage badge. Click it and you get the full picture for that turn:
- Input, output, and cache tokens
- The cost of the turn
- Which model responded, and how many requests it took
- Duration, and how the usage was matched to the message
The session overview rolls these up across the whole run, while the entries below break the same numbers down turn by turn.
Tool calls and results carry their own byte badges, so a tool that quietly returns a 200KB payload stops being invisible. That payload becomes tokens, and tokens are cost.
Why turn-level matters
Aggregate token counts answer the wrong question. “You spent 4 million tokens this week” tells you nothing actionable. The question operators actually ask is sharper: is the burn useful work, or is it session startup loading skills and MCP servers before a single real task runs?
Turn-level attribution is how you answer that. You can see a session spend most of its tokens on the first turn loading context and almost nothing on the work that followed, or see one tool that returns enormous results and inflates every turn that touches it. That moves token spend from a number on a bill to something you can act on.
This came directly out of observability conversations with teams running Claude Code at scale, where understanding token spend by session, by user, and by MCP server was a top evaluation criterion. You can only control the costs you can attribute.
How it works
The data comes from Claude Code’s own OpenTelemetry export. Claude Code emits OTel logs with token metrics on every turn. Speakeasy ingests them, stores them in ClickHouse alongside trace and span metadata, and aggregates per-turn and per-tool usage from those records. Following the OTel GenAI semantic conventions means the usage attributes (gen_ai.usage.input_tokens, gen_ai.usage.output_tokens, response model, conversation id) line up the same way across every session.
Matching usage back to the right message uses the Claude prompt id, falling back to turn order when the id isn’t available. The chat API exposes it all through agentUsage on the chat object, so the same data is available to anything built on top of the Speakeasy client.
There’s nothing to configure beyond the telemetry export Claude Code already supports. Sessions that emit OTel logs get enriched automatically, and the rest of the timeline is unaffected.
Get started
If your Claude Code clients are already exporting telemetry to Speakeasy, open a recent session in the logs view and click the usage badge on any message. The turn-level breakdown is there now. It joins the rest of the AI control plane, where the MCP gateway routes every agent through one entry point and the logs record what each one did.
Rolling out Claude Code across your org and want visibility into what it spends? Book time with our team and we’ll walk through it with you.
Last updated on