Data feeds: stream agent sessions, MCP traffic, and risk findings to the stack you already run

Nolan Di Mare Sullivan
September 17, 2026 · 6 min read
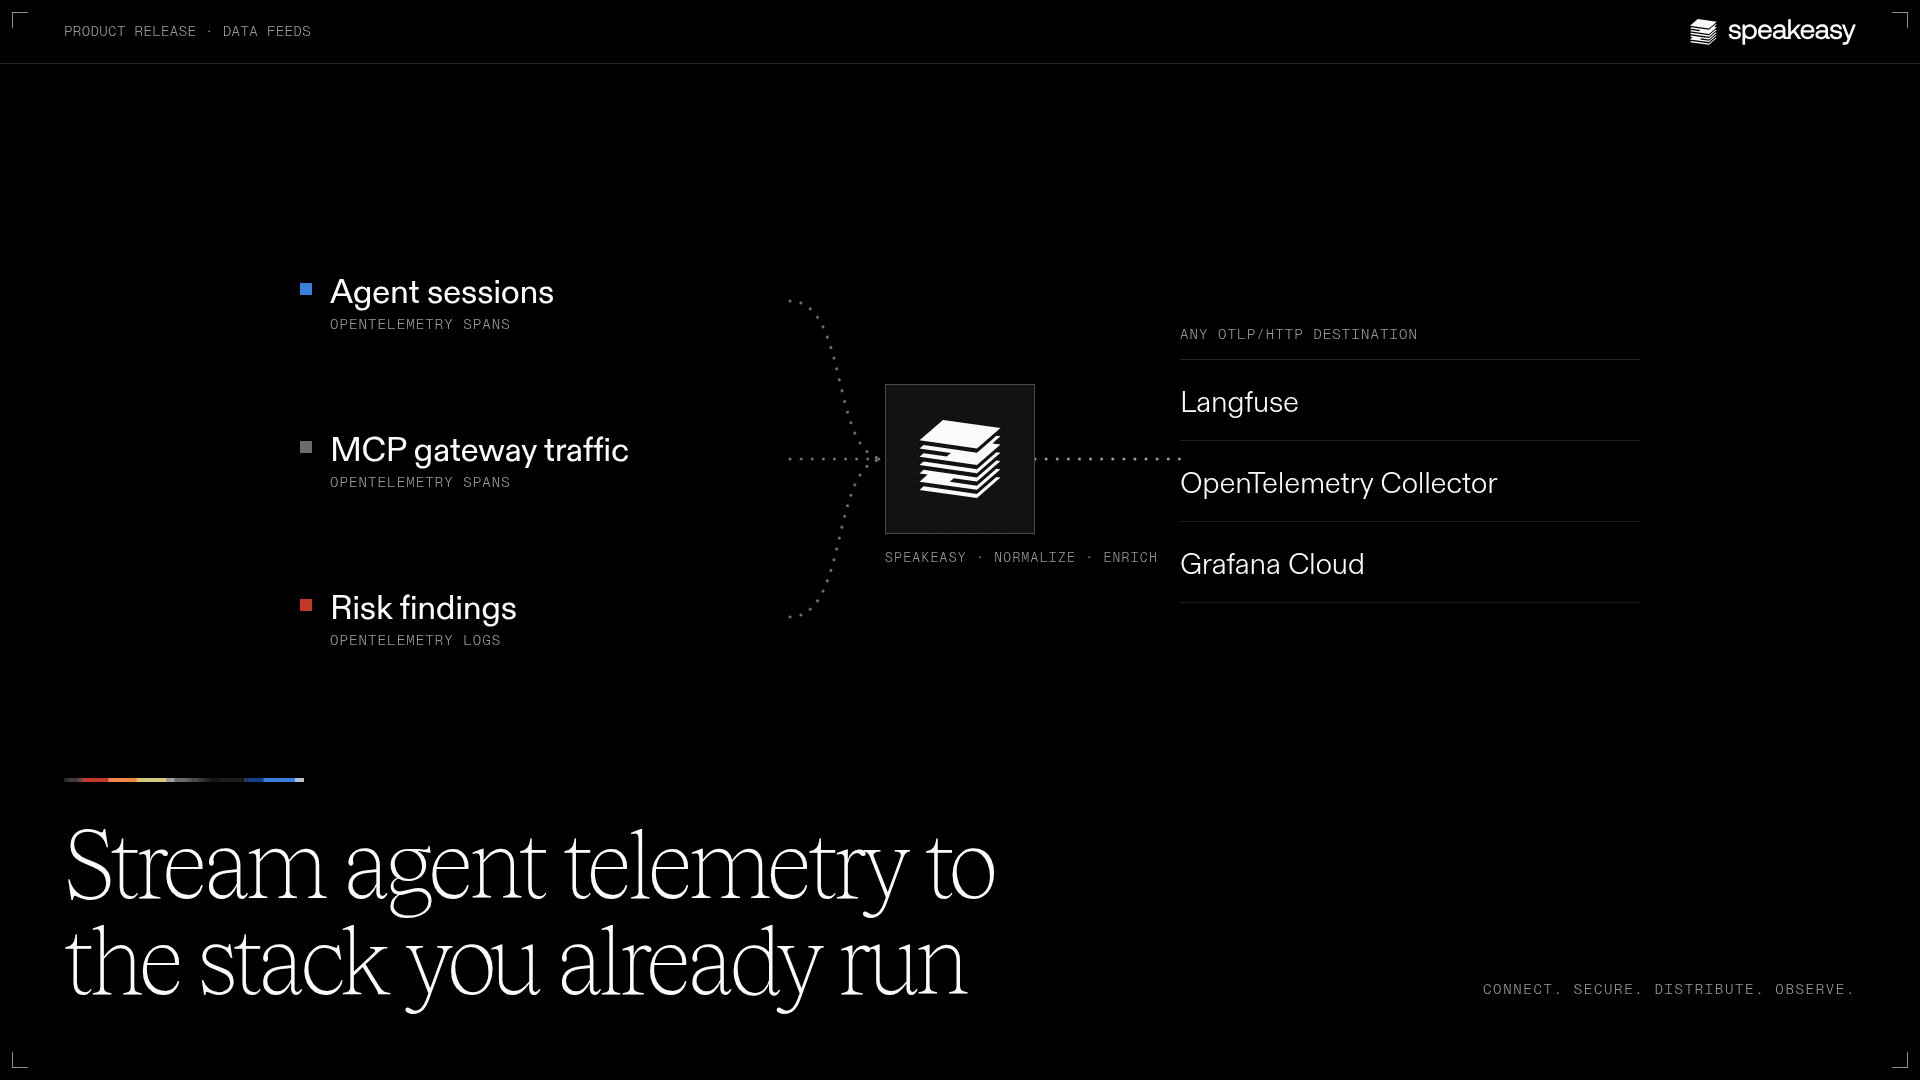
Every AI product your teams use emits its own telemetry, in its own format, to its own data store. Claude Code exports OpenTelemetry, Cursor exposes an Admin API, OpenAI publishes compliance logs, and each one names users, sessions, and tool calls differently. To get unified telemtry a platform team needs to create a collector and schema mapping per vendor, and then the security team needs to set up a sync to their SIEM where the rest of their audit log lives.
The Speakeasy AI Control Plane connects to every AI client automatically, standardizes their session logs into one schema, enriches logs with the MCP tool call data the clients are missing, and streams the combined record in a single format to the observability platform your team already runs.
| Feed | Wire shape | What it gives you |
|---|---|---|
| Agent sessions | OpenTelemetry spans, using the GenAI semantic conventions where they fit | Turns, tokens, and tool calls from Claude Code and other instrumented agents, per user |
| MCP gateway traffic | OpenTelemetry spans | Every tool call that passes through the gateway, with the server, the tool, and the caller |
| Risk findings | OpenTelemetry logs correlated to the spans above | Each guardrail match with a stable finding ID, policy, rule, source, and confidence |
Streaming feeds are available today for organizations on the AI Control Plane. An org admin configures them under Data > Exports in the dashboard, one route per project and feed, and the data export docs cover destination setup. Batch archive to object storage is in development and is not part of this release.
Why not point each provider's exporter at your collector?
You can. Claude Code emits OpenTelemetry natively, and if your organization runs one coding agent and one collector, sending it straight there is the right call and puts no vendor in the middle. Provider compliance APIs from Anthropic, OpenAI, and Cursor cover the audit case for chat, and Speakeasy imports from those same APIs.
The downside of this approach is that you end up maintaining a bunch of data connectors instead of one. Each provider is its own project, with its own field names, its own identity (an email in one, a workspace ID in another), and its own gaps. Also none of the AI clients report detailed logs on MCP tool calls.
Data feeds put the three streams through one pipeline. Every span and log carries the same speakeasy.organization.* and speakeasy.project.* attributes, and producer identity such as user.email stays on the signal, so a session in Langfuse, a tool call in your traces, and a finding in your SIEM name the same person the same way.
Send agent sessions and tool calls to the Langfuse project you already staff
If your team runs Langfuse, Grafana Cloud, or a Collector for LLM traces, the agent sessions and MCP gateway feeds arrive there as ordinary OTLP traces. Create a destination once with the base endpoint and headers, then attach the feeds you want from each project to it. Destination headers are encrypted at rest and write-only. The API confirms that a header exists but never returns the stored value.
Destinations exclude sensitive data by default: prompts, model input and output, tool arguments, tool results, and user identifiers are replaced with [REDACTED] while the attribute keys stay in place. A trace shows the shape of a session but not its content, and not the user's email, until you turn on Include sensitive data for that destination. Do that only after access control and retention are set on the receiving side. And delivery is asynchronous after ingestion.
Put risk findings next to the span that caused them
Guardrail policies record a finding for every match in an agent session, and Watchdog ranks them in the dashboard. A SOC that works out of a SIEM does not want a second console. The risk findings feed relays each new finding to the OTLP log destinations you configure as a privacy-safe log event: a stable finding ID for deduplication, plus the policy, rule, source, and confidence for filtering. It never carries the matched content, so a finding about a credential in a prompt does not put the credential in your SIEM. The finding correlates to the agent session span that produced it, so an analyst in the same backend moves from the alert to the tool call without leaving the tool they were in.
Exclusions are re-evaluated immediately before each delivery and fail closed. If the platform cannot confirm a finding is still in scope, it does not send it. The feed streams findings from the moment the route is enabled and does not backfill the ones that predate it. Historical export is the job of the archive path below.
What's next
The archive path is the next milestone, for the compliance reviewer who wants a quarter of sessions as files in a bucket rather than a live stream. Destination types beyond OTLP follow from the same API. The asks we hear most often are warehouse delivery, SIEM delivery for risk findings, and written guidance for analyzing the logs once they land, and that is the order we are working through.
Configure a feed under Data > Exports, or, if you are deciding where agent telemetry should live in your organization, book time with our team and bring the collector config.
What shipped in this release?
Data feeds on the Speakeasy AI Control Plane. Each project can stream agent sessions as OpenTelemetry spans, MCP gateway traffic as spans, and risk findings as OpenTelemetry logs to any destination that accepts OTLP over HTTP, including Langfuse, Grafana Cloud, and an OpenTelemetry Collector. Org admins configure routes and destinations under Data, then Exports, in the dashboard.
Is this the same as sending Claude Code telemetry straight to a collector?
No. A provider's native exporter covers one product and does not see the MCP tool calls that terminate at the gateway. Data feeds normalize telemetry from every instrumented agent, add organization and project attributes under the speakeasy namespace, include the MCP gateway path, and treat risk findings as a first-class feed correlated to the session spans.
Can I download an archive or get batch files in S3?
Not yet. This release covers streaming. Batch archive to S3-compatible object storage, with a webhook when each file lands, is in development. Until it ships, an OpenTelemetry Collector between Speakeasy and your bucket is the supported path.
Does the export include prompts and tool payloads?
Not by default. Destinations exclude sensitive data unless an admin turns on Include sensitive data for that destination. With the default policy, prompts, model input and output, tool arguments, tool results, and user identifiers arrive as [REDACTED] with the attribute keys intact. Risk finding logs never carry the matched content regardless of the setting.
Which destinations are supported?
Any endpoint that accepts OTLP/HTTP Protobuf at the standard signal paths. The docs walk through Langfuse, Datadog, Grafana Cloud, and a self-hosted OpenTelemetry Collector. There are no first-party SIEM, warehouse, or Kafka destinations in this release. Route those through a Collector.
Last updated on