Observability / Data export
Data export
Export normalized OpenTelemetry logs, metrics, and traces from each project to an OTLP/HTTP destination.
Data exports send normalized OpenTelemetry (OTEL) from AI products to project-scoped OTLP/HTTP destinations. The Exports page, under Organization settings > Data > Exports in the dashboard, shows every configured project route in one organization-level view. To confirm telemetry is reaching the platform before routing it anywhere, use the event feed.
Access requirements
Section titled “Access requirements”A direct OTEL connection requires a Hooks API key and a project slug.
Plugins handle the connection automatically. Viewing data exports requires the
org:read scope. Creating, changing, pausing, or deleting an export requires
the org:admin scope, which is
included in the default Admin
role.
How data exports work
Section titled “How data exports work”AI products with native OTEL exporters send telemetry to the platform. The platform normalizes each signal, adds organization and project context, and checks for an enabled data export route for that project. The route connects one data source to one OTLP destination.
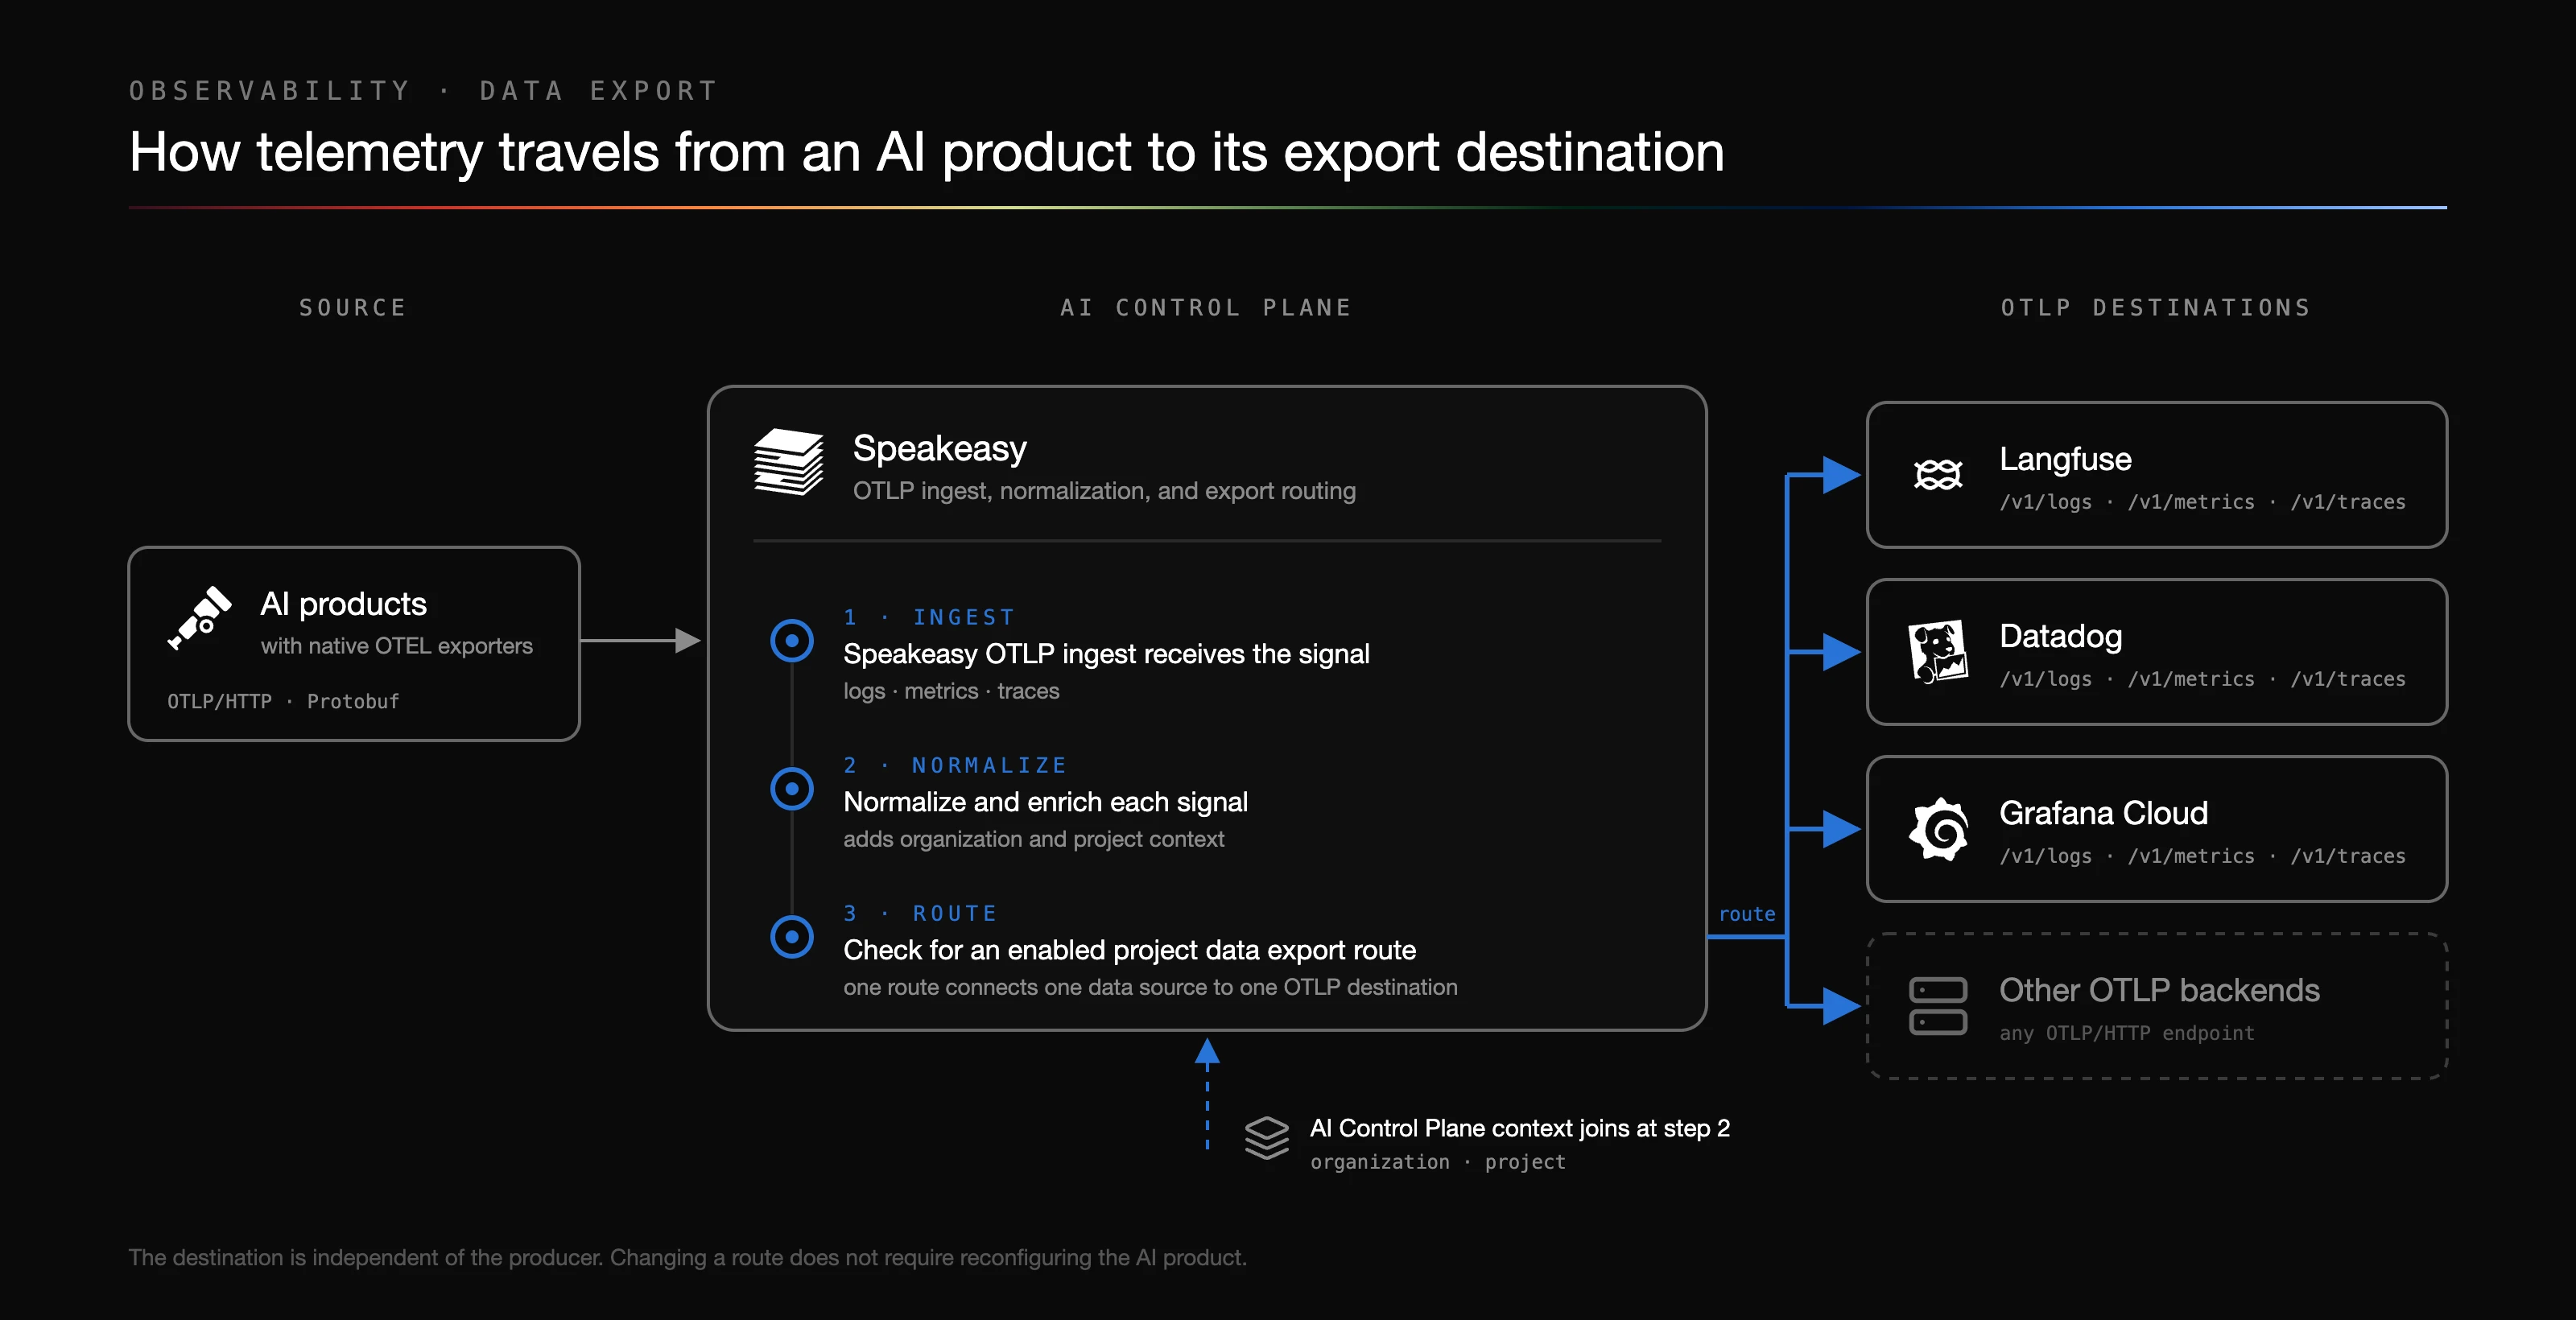
The destination is independent of the producer. Changing a route does not require reconfiguring the AI product that sends telemetry to the platform.
Current signal coverage
Section titled “Current signal coverage”Three data sources can be exported. Product telemetry exports normalized OTLP logs, metrics, and traces from supported products. Risk findings exports one OTLP log record per policy finding, carrying a stable finding ID, the policy and policy version, rule, source, confidence, and non-secret position anchors, never the matched content; exclusion rules are re-checked before every delivery so a finding excluded after detection is not exported. Tool call logs exports one OTLP log record for every tool call served for hosted or proxied MCP servers, the same records as Tool Logs, each carrying its log ID so a destination can deduplicate.
| Source | Signals | Export behavior |
|---|---|---|
| Compatible OTLP/HTTP producers | Logs, metrics, and traces | Normalized and sent as OTLP/HTTP Protobuf to /v1/logs, /v1/metrics, and /v1/traces |
| Products without an OTEL exporter | Plugin hook events | Available to Observability and Security and Policy, but not included in OTLP data exports |
| Risk findings | Logs | One privacy-safe record per finding, sent to /v1/logs; exclusions re-checked before delivery |
| Tool call logs | Logs | One record per tool call on hosted or proxied MCP servers, sent to /v1/logs with the log ID for deduplication |
OpenCode and OpenClaw do not expose native OTEL exporters. Their observability plugins still supply sessions, tool calls, tokens, and cost to the platform, but those plugin-only events are not part of the Product telemetry export.
Connect without a plugin
Section titled “Connect without a plugin”If a supported Speakeasy plugin is installed, skip this section. The plugin connects the product to the platform automatically. Configure an OTEL producer directly only when the product is not using a plugin.
Create a Hooks key from the API Keys page, then configure the product or its OpenTelemetry SDK to use OTLP over HTTP with Protobuf encoding.
Most OpenTelemetry SDKs accept the standard exporter environment variables:
export OTEL_EXPORTER_OTLP_ENDPOINT="https://app.getgram.ai/otel"export OTEL_EXPORTER_OTLP_PROTOCOL="http/protobuf"export OTEL_EXPORTER_OTLP_HEADERS="Gram-Key=<HOOKS_API_KEY>,Gram-Project=<PROJECT_SLUG>"The generic endpoint appends the signal path automatically. For a trace-specific exporter, set the complete endpoint instead:
export OTEL_EXPORTER_OTLP_TRACES_ENDPOINT="https://app.getgram.ai/otel/v1/traces"export OTEL_EXPORTER_OTLP_TRACES_PROTOCOL="http/protobuf"export OTEL_EXPORTER_OTLP_TRACES_HEADERS="Gram-Key=<HOOKS_API_KEY>,Gram-Project=<PROJECT_SLUG>"The trace endpoint accepts identity or gzip content encoding. Both the compressed request and its decompressed form must be no larger than 20 MiB. The endpoint acknowledges an export only after every span in the request has been accepted for processing, so standard OTLP retry behavior remains effective when ingestion fails.
Telemetry enrichment
Section titled “Telemetry enrichment”The trace pipeline keeps the original OTLP resource, scope, span, event, link, status, and producer attributes. It adds attributes under the speakeasy.* namespace when the corresponding context is available.
| Attribute | Description |
|---|---|
speakeasy.organization.id | AI Control Plane organization ID derived from the authenticated request |
speakeasy.organization.slug | Organization slug, when available |
speakeasy.project.id | Project ID derived from the authenticated request |
speakeasy.project.slug | Project slug, when available |
speakeasy.api_key.id | ID of the key that supplied the telemetry, when available |
speakeasy.api_key.name | Name of the key that supplied the telemetry, when available |
speakeasy.tokens.count | Token count calculated from supported prompt and completion attributes |
speakeasy.tokens.codec | Tokenizer used for speakeasy.tokens.count |
speakeasy.original_instrumentation_scope.name | Producer scope name before normalization, when one was present |
Instrumentation scopes are normalized to com.speakeasy.ai.tracing. Unknown OTLP fields are retained for forward compatibility, while private transport metadata is removed before export.
Identity context
Section titled “Identity context”Producer identity attributes such as user.email and user.id remain on the signal. Elsewhere in the AI Control Plane, these values resolve against organization membership and Directory Sync, which provides department, division, job title, employee type, cost center, IdP groups, and role context for identity-aware Observability views when that data is available from the connected directory.
Configure a data export
Section titled “Configure a data export”Open Organization settings > Data > Exports in the dashboard. The page combines configured exports from every visible project into one topology.
To add an export:
- Click New export.
- Choose a project. The picker includes only projects that do not already have a route for the selected data source.
- Choose Product telemetry, Risk findings, or Tool call logs under Data to export.
- Select an existing destination for that project, or select Create a new destination.
- For a new destination, enter a name, the base OTLP endpoint, and any required headers.
- Choose whether to include sensitive data.
- Leave Start exporting on to enable delivery immediately, or turn it off to save the route paused.
- Click Create export.
The endpoint must use HTTP or HTTPS. Enter the base without /v1/traces, /v1/logs, or /v1/metrics. The platform appends the path for each signal.
Destination headers are encrypted at rest and write-only. The API returns each header name and whether a value exists, but never returns the stored value.
Control sensitive data
Section titled “Control sensitive data”New destinations exclude sensitive data by default. The exclude policy replaces classified content and identity values with [REDACTED] while preserving the OTLP attribute keys. Classified values include prompts, model input and output, tool arguments, tool results, and user identifiers.
Turning on Include sensitive data preserves the normalized OTLP payload. Apply access controls and retention policies at the destination before enabling this setting.
The policy belongs to the destination. Selecting an existing destination uses its stored policy.
Manage an export
Section titled “Manage an export”The Exports page draws every route as one map, with Data on the left and Sent to on the right. Each source card includes controls to pause or enable delivery, change its destination, or delete the route. Deleting an export stops delivery and removes the route. The destination remains available for another export in the same project.
To receive risk findings over plain HTTP instead of OTLP, subscribe to risk_finding events with Webhooks.
Confirm telemetry is arriving
Section titled “Confirm telemetry is arriving”The Event Feed page, under Organization settings > Data > Event Feed, lists every OpenTelemetry log record and span the platform has ingested across the organization, whichever project or API key delivered it. Use it to confirm telemetry is arriving while connecting a plugin, a direct OTLP producer, or an AI integration, before any Observability page has processed the data. The feed is in preview. Viewing it requires the org:read scope.
Filter by time range, kind (logs or spans), source, and name, or search event bodies. Select an event to see its trace and span IDs, attributes, and the full record. The feed is read-only. What appears in it depends on the switches in Logging Settings and on which producers send telemetry.
Choose a destination
Section titled “Choose a destination”Data exports use the open OTLP/HTTP format. Any destination that accepts OTLP/HTTP Protobuf at the standard signal paths can receive exported telemetry. The configurations below support OTLP/HTTP traces. Confirm log and metric support with the destination when all three signals are required.
Langfuse
Section titled “Langfuse”Use the regional base endpoint ending in /api/public/otel. Add a Basic Authorization header. Langfuse v4 also recommends the x-langfuse-ingestion-version: 4 header. See the Langfuse OpenTelemetry integration.
Datadog
Section titled “Datadog”Use the site-specific OTLP intake base endpoint and add a dd-api-key header. The optional compute_stats: true header enables trace metrics. Datadog recommends the Datadog Agent or OpenTelemetry Collector for production workloads. See the Datadog OTLP intake documentation.
Grafana Cloud
Section titled “Grafana Cloud”Copy the base endpoint and Basic Authorization header from the OpenTelemetry connection tile for the Grafana Cloud stack. See the Grafana Cloud OTLP documentation.
OpenTelemetry Collector
Section titled “OpenTelemetry Collector”Use the OTLP/HTTP receiver base URL, commonly port 4318, plus any headers enforced by the collector. The collector can process or route signals before sending them to another backend. See the OpenTelemetry Collector receiver documentation.
For a destination that supplies a signal-specific URL ending in /v1/traces, remove that suffix before saving the endpoint.
Delivery behavior
Section titled “Delivery behavior”The platform sends normalized logs, metrics, and traces as application/x-protobuf. It appends the standard signal path to the configured base endpoint and applies the destination headers to every request.
Delivery is asynchronous after ingestion. The relay retries transient network failures, 408 and 429 responses, and 5xx responses. Other 4xx responses are treated as permanent configuration or authentication failures. Each outbound attempt has a ten-second timeout.
Delivery failures do not affect the source agent or the copy processed by the platform for Observability and Security and Policy. Route and destination changes can take up to 60 seconds to reach every relay worker.