Observability / Costs
Costs
Track AI spend across the organization, from org-wide totals down to individual sessions.
The Costs page tracks AI spend across the organization. Open it from Observability > Costs in the dashboard. Where budgets are enabled for the organization, the page gains a Costs and Budgets tab strip; see Budgets.
Access requirements
Section titled “Access requirements”Viewing this page requires the org:admin scope. Access is included in the default Admin role but not the Member role: the nav entry stays visible to Members, but opening the page shows an access-restricted notice.
How cost is calculated
Section titled “How cost is calculated”Cost figures are reported by the AI client rather than recomputed by the platform. Claude Code calculates cost as token usage multiplied by published API rates and includes it in the telemetry it emits, and the platform sums those reported values per session and model. In device telemetry, only Anthropic clients report dollar costs. Connected provider integrations fill the gap for other clients: OpenAI Compliance Logs supplies Codex and ChatGPT spend, including Codex cloud surfaces that emit no device telemetry, and the Cursor integration supplies Cursor spend. Sessions from clients that report no cost and have no provider integration contribute $0 to totals, though token counts remain available for every client. There is no fallback pricing table, so usage from an unrecognized model shows only whatever cost its client reported, which is usually nothing. What the organization is charged, as opposed to what each team spends, is on Billing.
Token totals count input, output, and cache-creation tokens. Cache reads are excluded so that reused context is not double-counted. Reported totals from clients are not trusted directly because some include cache reads and others report no total at all.
Why costs are labeled estimates
Section titled “Why costs are labeled estimates”Token usage priced at standard API rates equals real spend only for metered, pay-per-token accounts. Flat-fee plans (Claude Max, Pro, and Team) include usage in the subscription, so real spend may be lower than the calculated figure. The dashboard labels a figure Cost only when an admin has declared every contributing account as metered. Any mix that includes flat-rate or undeclared accounts shows Est. cost instead, with an info tooltip explaining the estimate.
Headline metrics
Section titled “Headline metrics”The top of the page summarizes the selected period:
- Total Tokens: input and output tokens summed across all members, with the session count shown beneath.
- Total Cost: client-reported spend summed across all members. Shows “No cost data reported” when no client in the period reported cost.
- Active Users: members with any token usage in the period, shown against the total member count.
- AI Clients: the number of distinct AI clients generating usage, such as Claude Code, Codex, and Cursor.
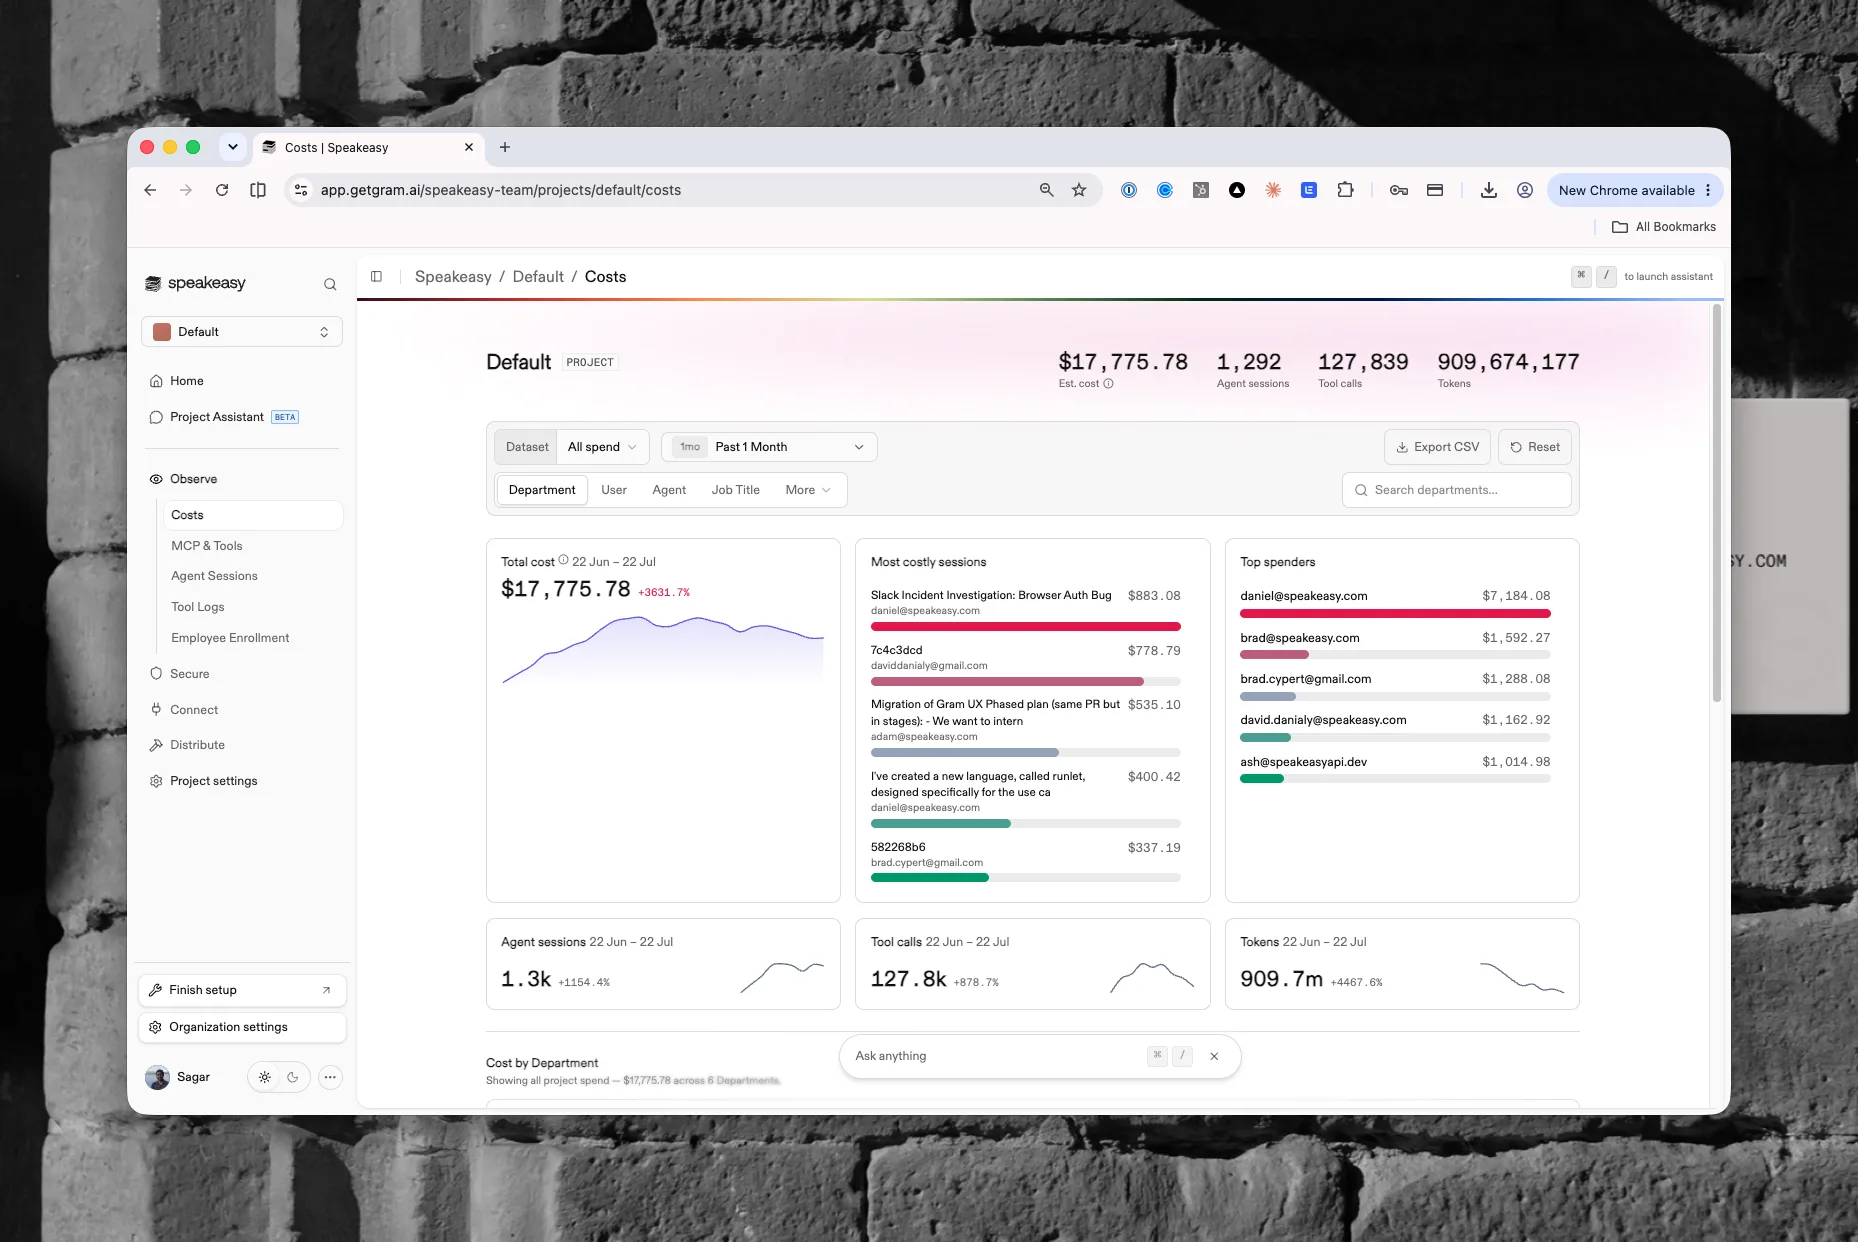
Charts break the period down further. Tokens Over Time and Cost Over Time show daily usage, Usage by Client splits spend across AI clients, and Requests by Model counts requests per model. Panels for Most costly sessions and Top spenders rank where spend concentrates.
Breakdowns
Section titled “Breakdowns”Two tables break spend down by organizational dimension:
- The role table shows, per role: users, total cost with its share of spend, average cost per user, input tokens, output tokens, and sessions. Members without an assigned role appear under “no role”.
- The employee table shows, per member: input, output, and total tokens, cost, cost per session (total cost divided by sessions), sessions, and share (the member’s percentage of total spend).
Toggle between Tokens and Cost ($) to switch the measure, and filter the page by date range, agent, and account type.
Cost explorer
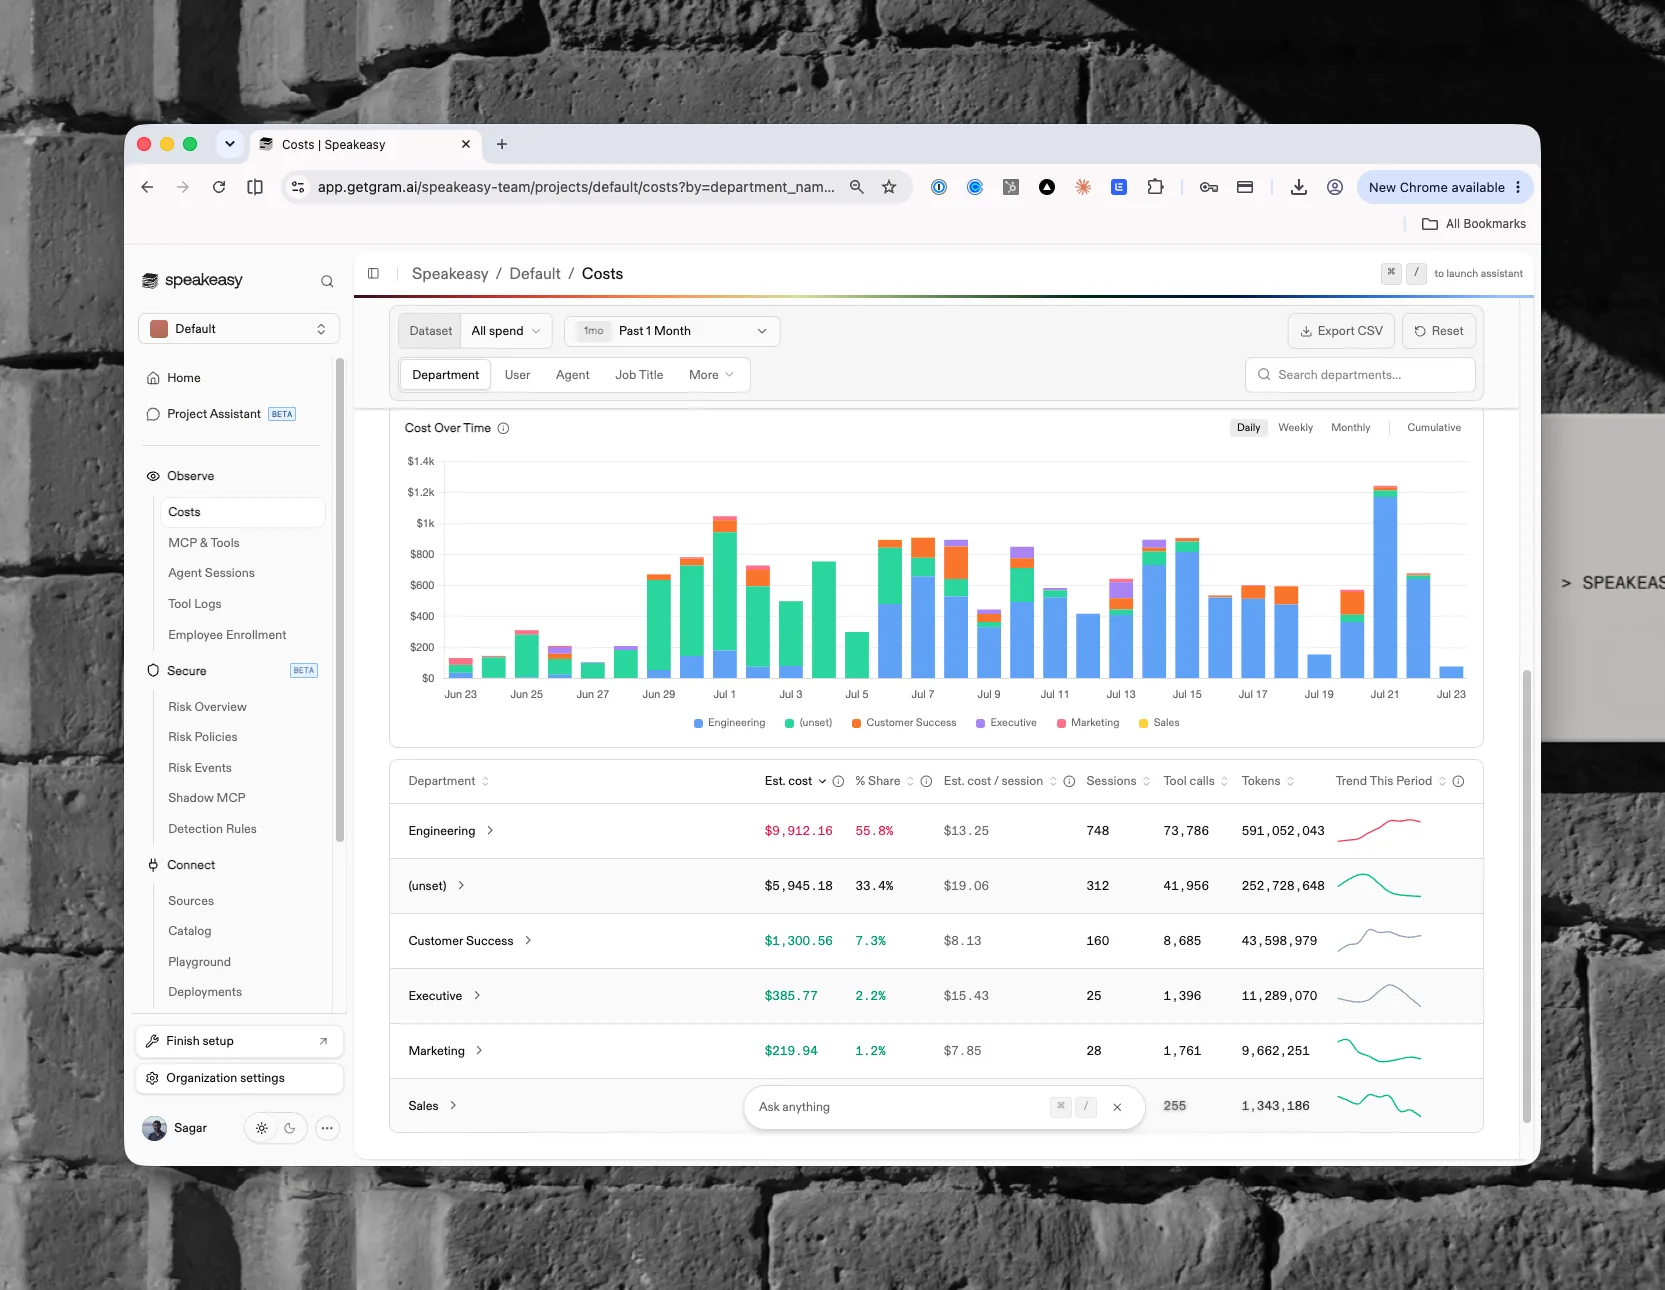
Section titled “Cost explorer”A cost explorer view is rolling out that turns Costs into a drill-down taxonomy. Pick a dimension to group by, including division, department, user, job title, employment type, cost center, role, model, agent, provider, account type, MCP server, MCP tool, subagent, or skill. Dimensions with no data in the selected range are hidden. Each level defines its columns as follows:
- Cost or Est. cost: reported spend for the group, following the labeling rule above.
- % Share: the group’s share of total cost across all groups in the view. The denominator includes the “Other” rollup row, so shares sum to roughly 100%.
- Cost / session: group cost divided by group sessions. Shows a dash when the group has no sessions.
- Sessions: the count of distinct agent sessions in the group. Because sessions can span multiple groups, headline session counts are computed separately rather than by summing rows.
- Tool calls: deduplicated tool executions across clients. On MCP server, MCP tool, subagent, and skill views, a Tokens added column replaces it, measuring the tokens that entity adds to a session’s context.
- Tokens: input, output, and cache-creation tokens, with cache reads excluded.
- Trend This Period: a sparkline of daily cost for the group over the selected range.
Each level also shows headline stats for the current entity, a Total cost trend chart, Top spenders, spend by the chosen dimension, and the Most costly sessions in the slice.
Trend indicator legend
Section titled “Trend indicator legend”The sparkline color reflects the smoothed direction of daily cost over the selected range. Green means cost is trending down, red means cost is trending up, and grey means no clear trend. Rising cost shows red because an upward trend is the signal to investigate. Choppy or mixed movement counts as no clear trend rather than forcing a direction.
Working with the data
Section titled “Working with the data”- Drill through the taxonomy by clicking any row, or by clicking a segment of the stacked cost chart above the table. The chart and the table share colors and hover state, so hovering a segment highlights its row and hovering a row spotlights its segment; dragging on the chart still selects a date range. The click filters the view to that group and advances to the next level, following a suggested path from division to department to user to agent. Drilling into an agent, model, MCP tool, or skill jumps straight to that group’s session list. Drill state lives in the URL, so any view can be shared or bookmarked, and breadcrumbs step back up the path.
- Compare periods with the date-range picker, which defaults to 30 days and offers presets and custom ranges. Every headline stat shows a % delta against the previous period of equal length, colored red when cost is up and green when it is down.
- Narrow the view with the Dataset selector, choosing between All spend, MCP, Subagents, and Skills to focus on an attribution slice.
- Export the current view with the Export CSV button. Dimension tables export their columns with raw numbers, and session lists export session, user, agent, model, cost, tokens, tool calls, messages, and duration.
- Open session detail from the session list, which shows the 100 most expensive sessions in the slice with user, agent, model, cost, tokens, tool calls, messages, and duration per session. Clicking a session opens its full trace in a detail view.