Observability / Tool Logs
Tool Logs
The raw stream of tool executions across MCP servers, skills, and local tools, with trace expansion and attribute filters.
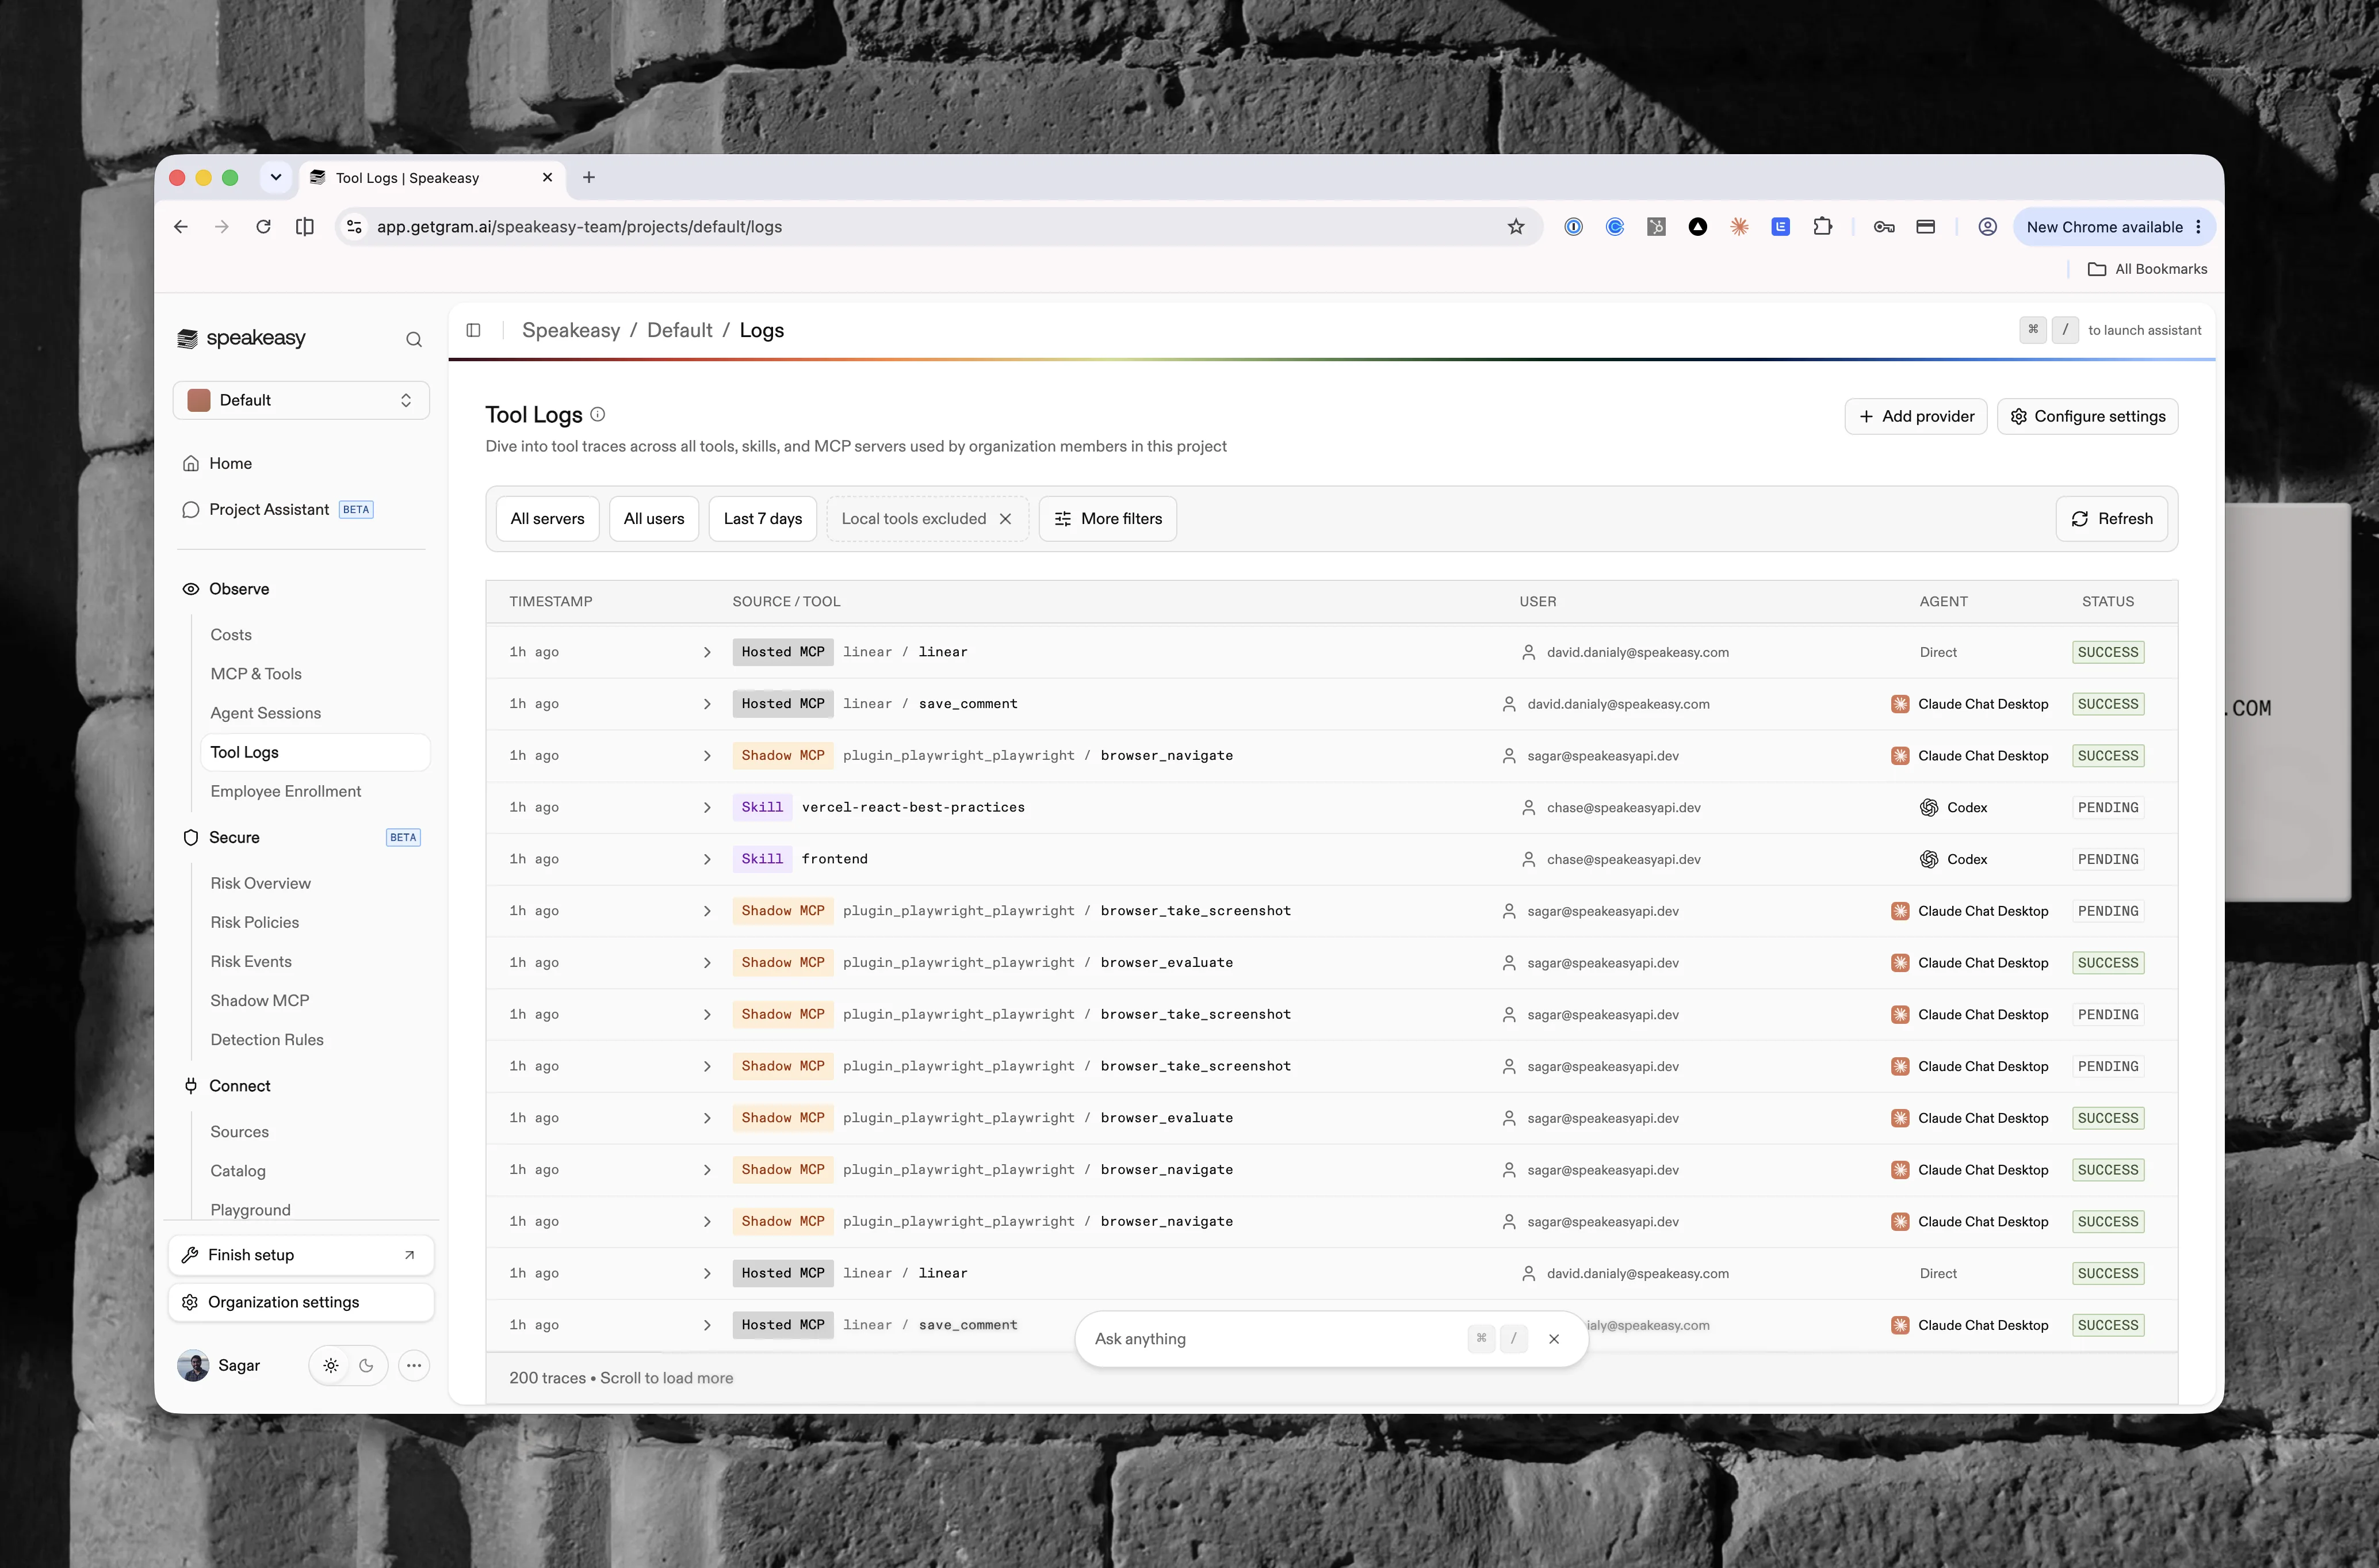
The Tool Logs page is the raw execution log for every tool call the platform observes across hosted MCP servers, tunneled and shadow MCP servers, skills, and local tools. Open it from Observability > Tool Logs in the dashboard, or arrive from any row on MCP Insights, which opens the stream already narrowed to that server, tool, client, skill, or person. Where Agent Sessions answers “what happened in this conversation”, Tool Logs answers “what happened in this tool call” and lets an investigation cut across every session at once.
Access requirements
Section titled “Access requirements”Viewing this page requires the org:admin scope. Access is included in the default Admin role but not the Member role: the nav entry stays visible, but opening the page shows an access-restricted notice.
Log stream
Section titled “Log stream”The page is laid out like a traces explorer: a facet rail on the left, a summary strip and brushable timeline above the rows, and a dense table below. The table is infinite-scrolling, with columns for Time, Server, Tool, Type, User, and Client, plus the status of each call. Status badges are Success, Error, Blocked, and Pending. Target types are labeled Hosted MCP, Tunneled MCP, Gateway, Shadow MCP, Skill, and Local Tools.
The Client column names the MCP client that made the call, taken from the name and version the client reports when it connects to a server. Calls the platform never saw a handshake for, such as hook-observed calls, pre-handshake sessions, and non-MCP tool calls, show a dash rather than borrowing the agent’s name, since that would credit a harness that never spoke MCP to the platform.
Summary and timeline
Section titled “Summary and timeline”The Summary and timeline strip reports Tool calls, Failures, Failure rate, Blocked rate, and Tools for the whole selected window, not just the pages loaded so far, so the numbers do not change as the list scrolls. The timeline below it stacks Calls, Failures, Blocked, and Pending per bucket; drag across it to narrow the time range to that region.
Structured filters
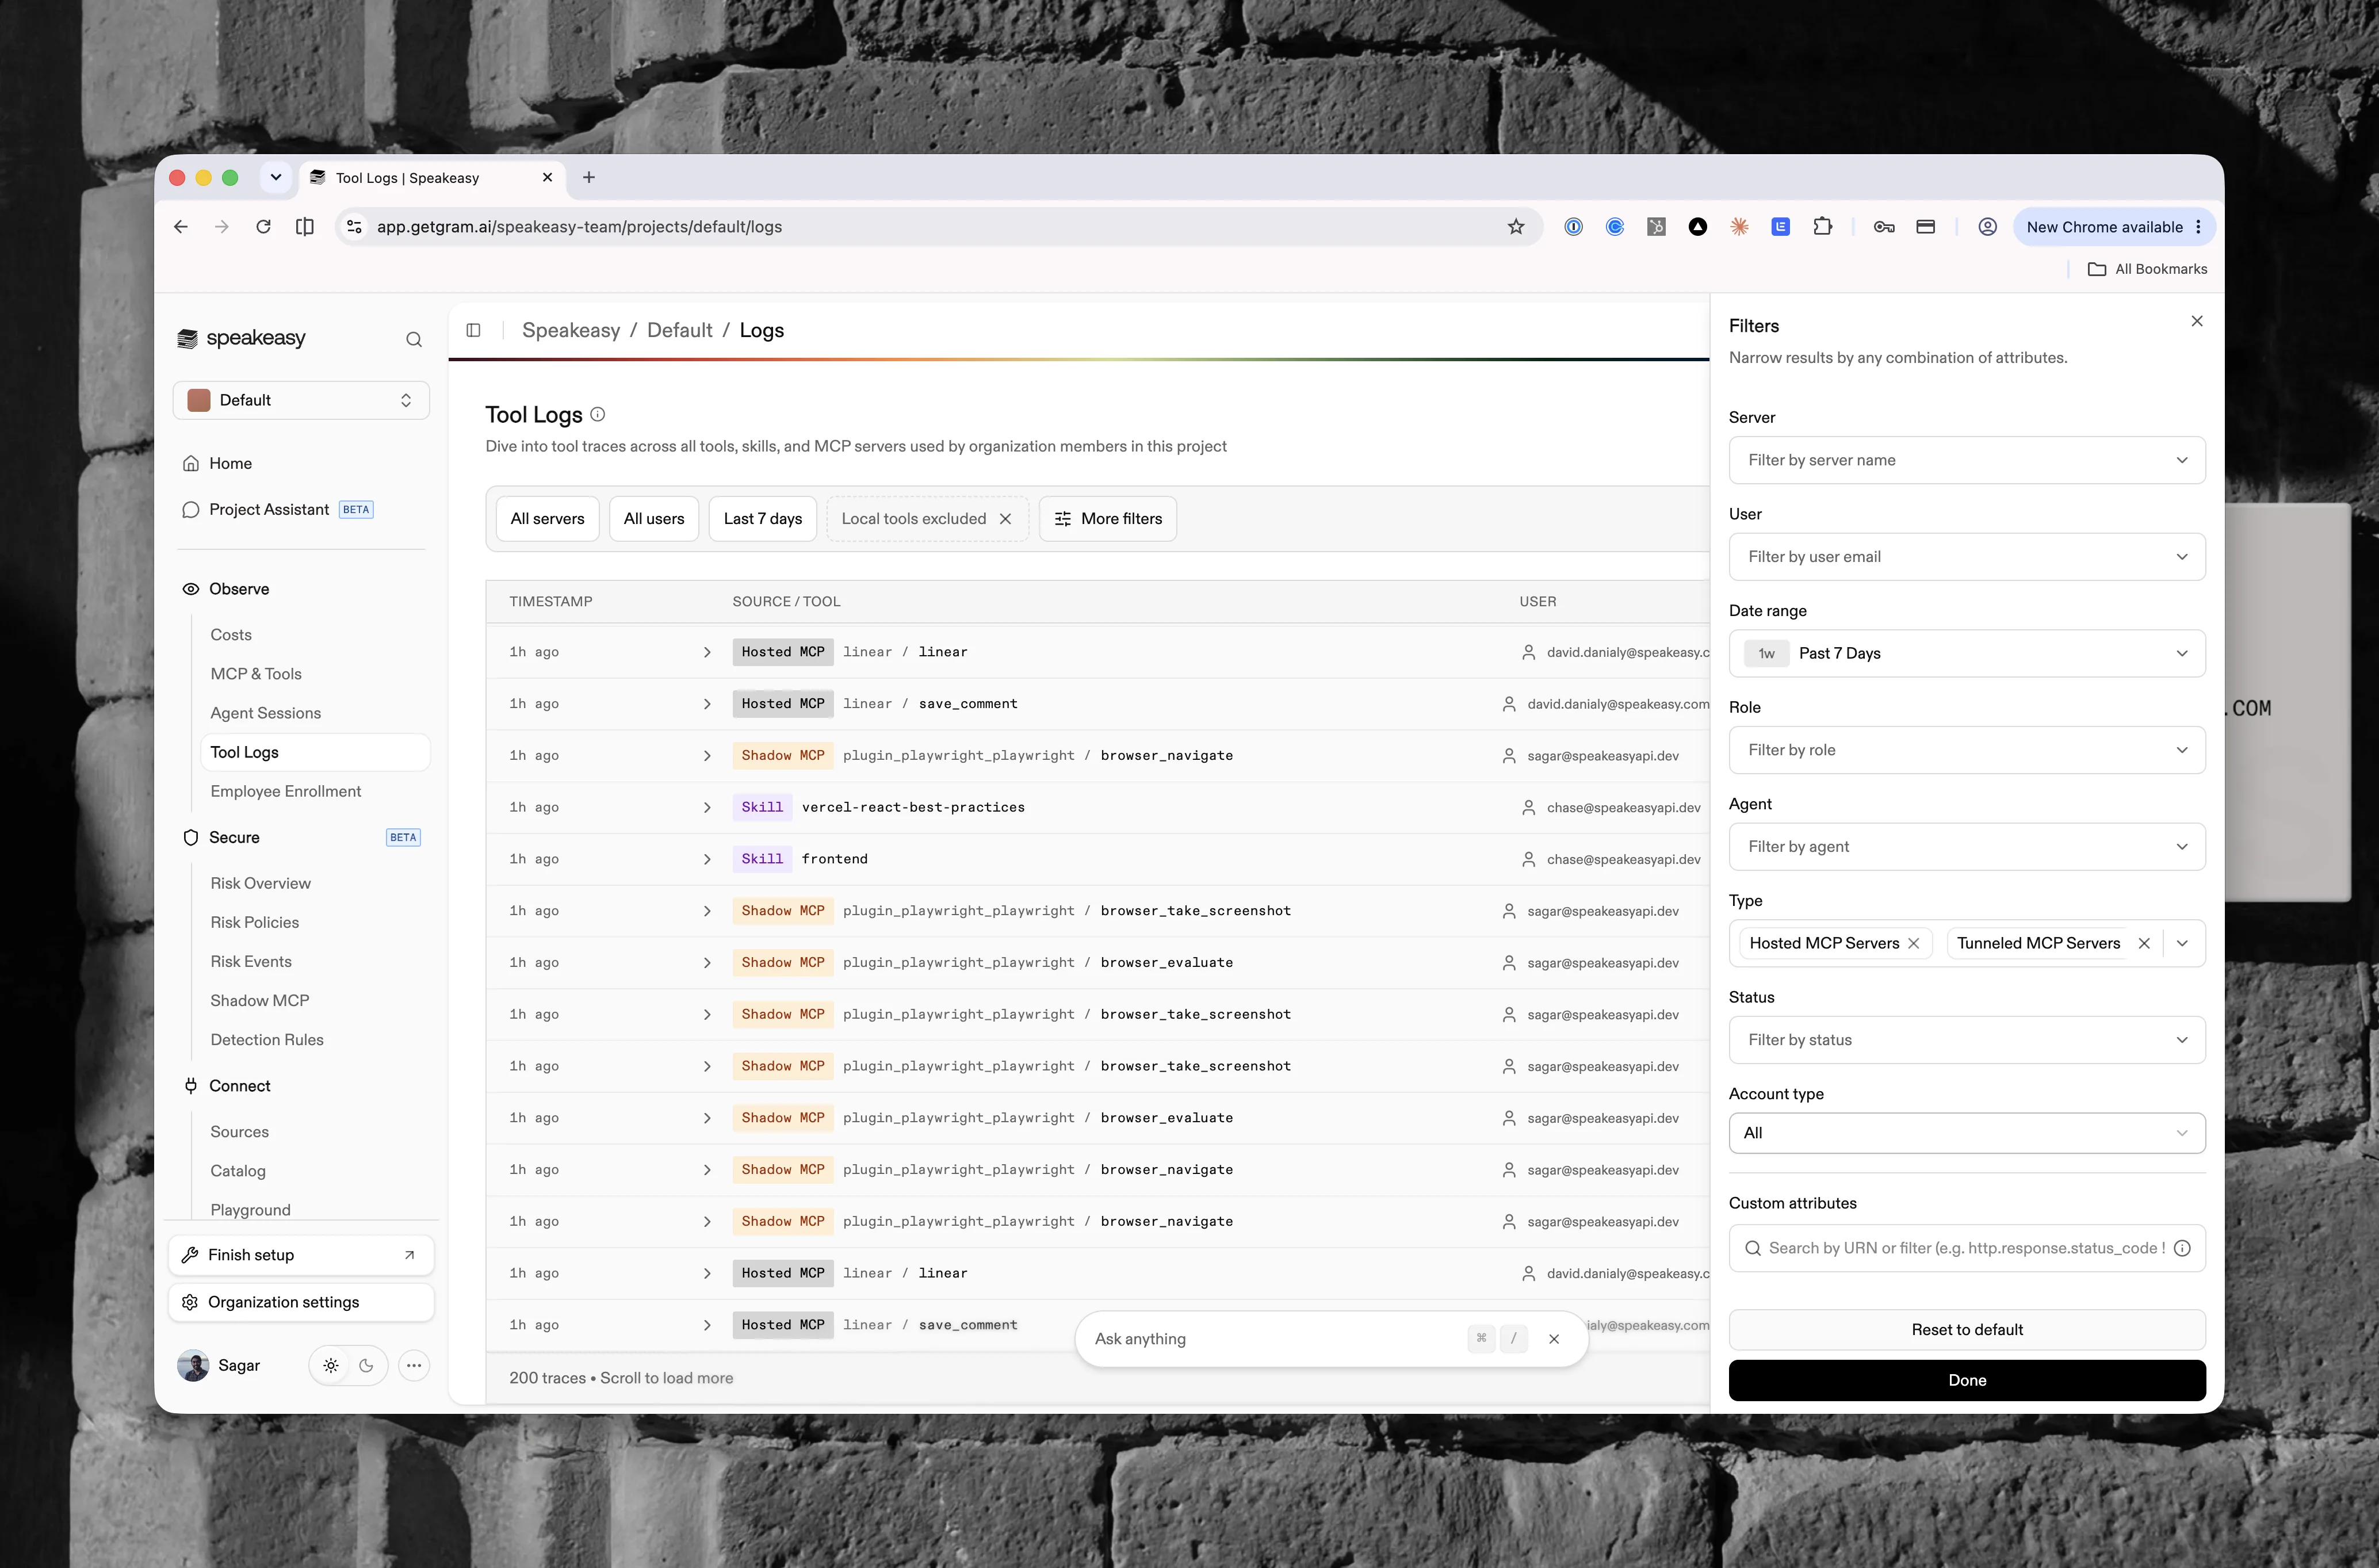
Section titled “Structured filters”The Filters rail lists every dimension’s values with a count of matching calls in the selected window, and narrows the stream using pre-aggregated summaries, so these filters stay fast at any volume:
- Time range sits at the top of the rail, with presets from 15 minutes to 90 days (default 7 days) plus custom ranges.
- MCP server filters by server name, with per-server event counts from the selected time window.
- Client filters by the MCP client that made the call, such as Claude Code or Cursor, as reported at the MCP handshake.
- Status lists Blocked, Error, Pending, and Success in severity order.
- Type selects among Hosted MCP Servers, Tunneled MCP Servers, Gateways, Shadow MCP Servers, Local Tools, and Skills. Calls a gateway dispatches to a member are attributed to the member and marked with a gateway icon naming the gateway that routed them; calls observed against the gateway itself are tagged Gateway. Gateways also appear by name in the MCP server facet, which narrows the log to either kind. See Gateways.
- Agent filters by the coding agent or harness that made the call, such as Claude Code, Cursor, or Codex.
- Role resolves org roles to their member emails.
- Account picks Team or Personal; one applies at a time.
- User filters by member email, listing every user seen in the window.
Every selection is written to the URL, so a narrowed view survives refreshes and bookmarks, and the rail can be resized or collapsed. The rail and the MCP Insights board write the same URL parameters, which is what lets a row there open the exact slice here.
Attribute filters
Section titled “Attribute filters”For anything the structured bar doesn’t cover, the Custom attributes control builds filters against raw log attributes. The input doubles as free-text search and a filter builder, with the placeholder “Search by URN or filter (e.g. http.response.status_code != 200)”.
Typing opens a guided flow: pick an attribute key from the keys actually present in the selected time range, pick an operator, then type a value. Four operators are available:
| Operator | Name | Matches |
|---|---|---|
= | equals | Exact match |
!= | not equals | Excludes an exact match |
~ | contains | Partial match anywhere in the value |
in | in | Any value in a comma-separated list (value1, value2, ...) |
Freeform expressions work too — typing http.response.status_code != 200 and pressing Enter parses directly into a filter chip. A Sample filter queries popover offers ready-made starting points:
| Search | Expression | What it finds |
|---|---|---|
| Non-2xx responses | http.response.status_code != 200 | Every call whose upstream API answered with anything but 200 |
| Server errors only | http.response.status_code = 500 | Calls that hit upstream 500s |
| Error-level logs | severity_text = ERROR | Log entries recorded at error severity, whatever their HTTP status |
| POST requests only | http.request.method = POST | Calls that performed writes via POST |
| Tool names containing “search” | gram.tool.name ~ search | Every tool whose name includes the term, across all servers |
The same shapes combine for narrower questions: gram.tool.name ~ issue plus http.response.status_code != 200 isolates failing issue-related tools, and http.request.method in POST, PUT, DELETE finds every mutating call in the window.
Chips are editable in place. Click a chip to change its operator or value, remove it with its close button, or clear all chips at once. Adding an = or in filter replaces any existing filter on the same key and operator, while != and ~ filters stack, so layering multiple exclusions is safe.
Attribute filters scan raw logs rather than the pre-aggregated summaries, so server, client, status, type, user, and date filters stay fast while attribute filters may take longer. A tool name has no summary field of its own, which is why a drill-down from MCP & Tools on a tool arrives as an attribute chip on gram.tool.name rather than a facet selection.
Shareable views
Section titled “Shareable views”Attribute filters serialize into the URL as ?af= and free-text search as ?q=, alongside the structured filter params. Every filtered view is a link. To hand off an investigation, narrow the stream, copy the URL, and paste it into a ticket or chat. The recipient lands on the exact same view.
Trace expansion
Section titled “Trace expansion”Clicking a row expands it and loads the other logs in the same trace, correlated by the trace or trigger ID the entry carries. Child rows show a tree connector, a severity badge (info, warn, error, or debug), a timestamp, and the log message, so the full lifecycle of a single tool call reads top to bottom. A blocked trace shows an inline Blocked banner with the block reason when the policy provided one.
Log detail
Section titled “Log detail”Clicking a child log opens the detail sheet with Details and Raw Data tabs. The header carries copyable badges for the service, platform URN, trace ID, span ID, and time. The Details tab highlights the server, tool, LLM client, and MCP server URL, with collapsible Tool Input and Tool Output sections showing pretty-printed arguments and results (hidden when tool I/O logging is disabled), a flattened Attributes section, and the raw message. Failed calls surface a Tool Error callout, and blocked calls surface the Block Reason.
Building filters from a log
Section titled “Building filters from a log”Every filterable attribute row in the detail sheet is a dropdown offering Filter by, Exclude, Contains, and Copy value. Selecting one adds the corresponding chip to the page’s attribute filter bar and updates the URL immediately, so a single interesting log can pivot into a query without retyping keys or values.
Debugging workflows
Section titled “Debugging workflows”The pieces combine into a few common investigations:
- Find a failing tool. Set Status to Error, or add
http.response.status_code != 200from the sample queries. Expand a failing trace to read its child logs, open the detail sheet, and check the Tool Error callout and the tool input that triggered it. - Isolate one user’s calls. Pick the user’s email in the User facet, tighten the Time range to the incident window, and add attribute filters from any suspicious log to narrow further. To see the same person’s sessions, devices, and risk findings alongside their calls, open their identity page.
- Chase a pattern across servers. Start from one bad log, use Filter by on its attributes to pin the tool or status, then clear the MCP server facet to see whether the same pattern appears elsewhere.
- Share the evidence. Once the view shows the problem, copy the URL. Teammates open the identical filtered stream and can keep refining it.
To stream calls served by hosted or proxied MCP servers to a collector, configure a Tool call logs export. Hook-reported calls, such as shadow MCP servers, skills, and local tools, are not part of that export. See Export MCP tool call logs.