Observability / MCP Insights
MCP Insights
Usage analytics for MCP servers and tools: call volumes, failures, and ranked lists of the most used servers, tools, clients, skills, and people.
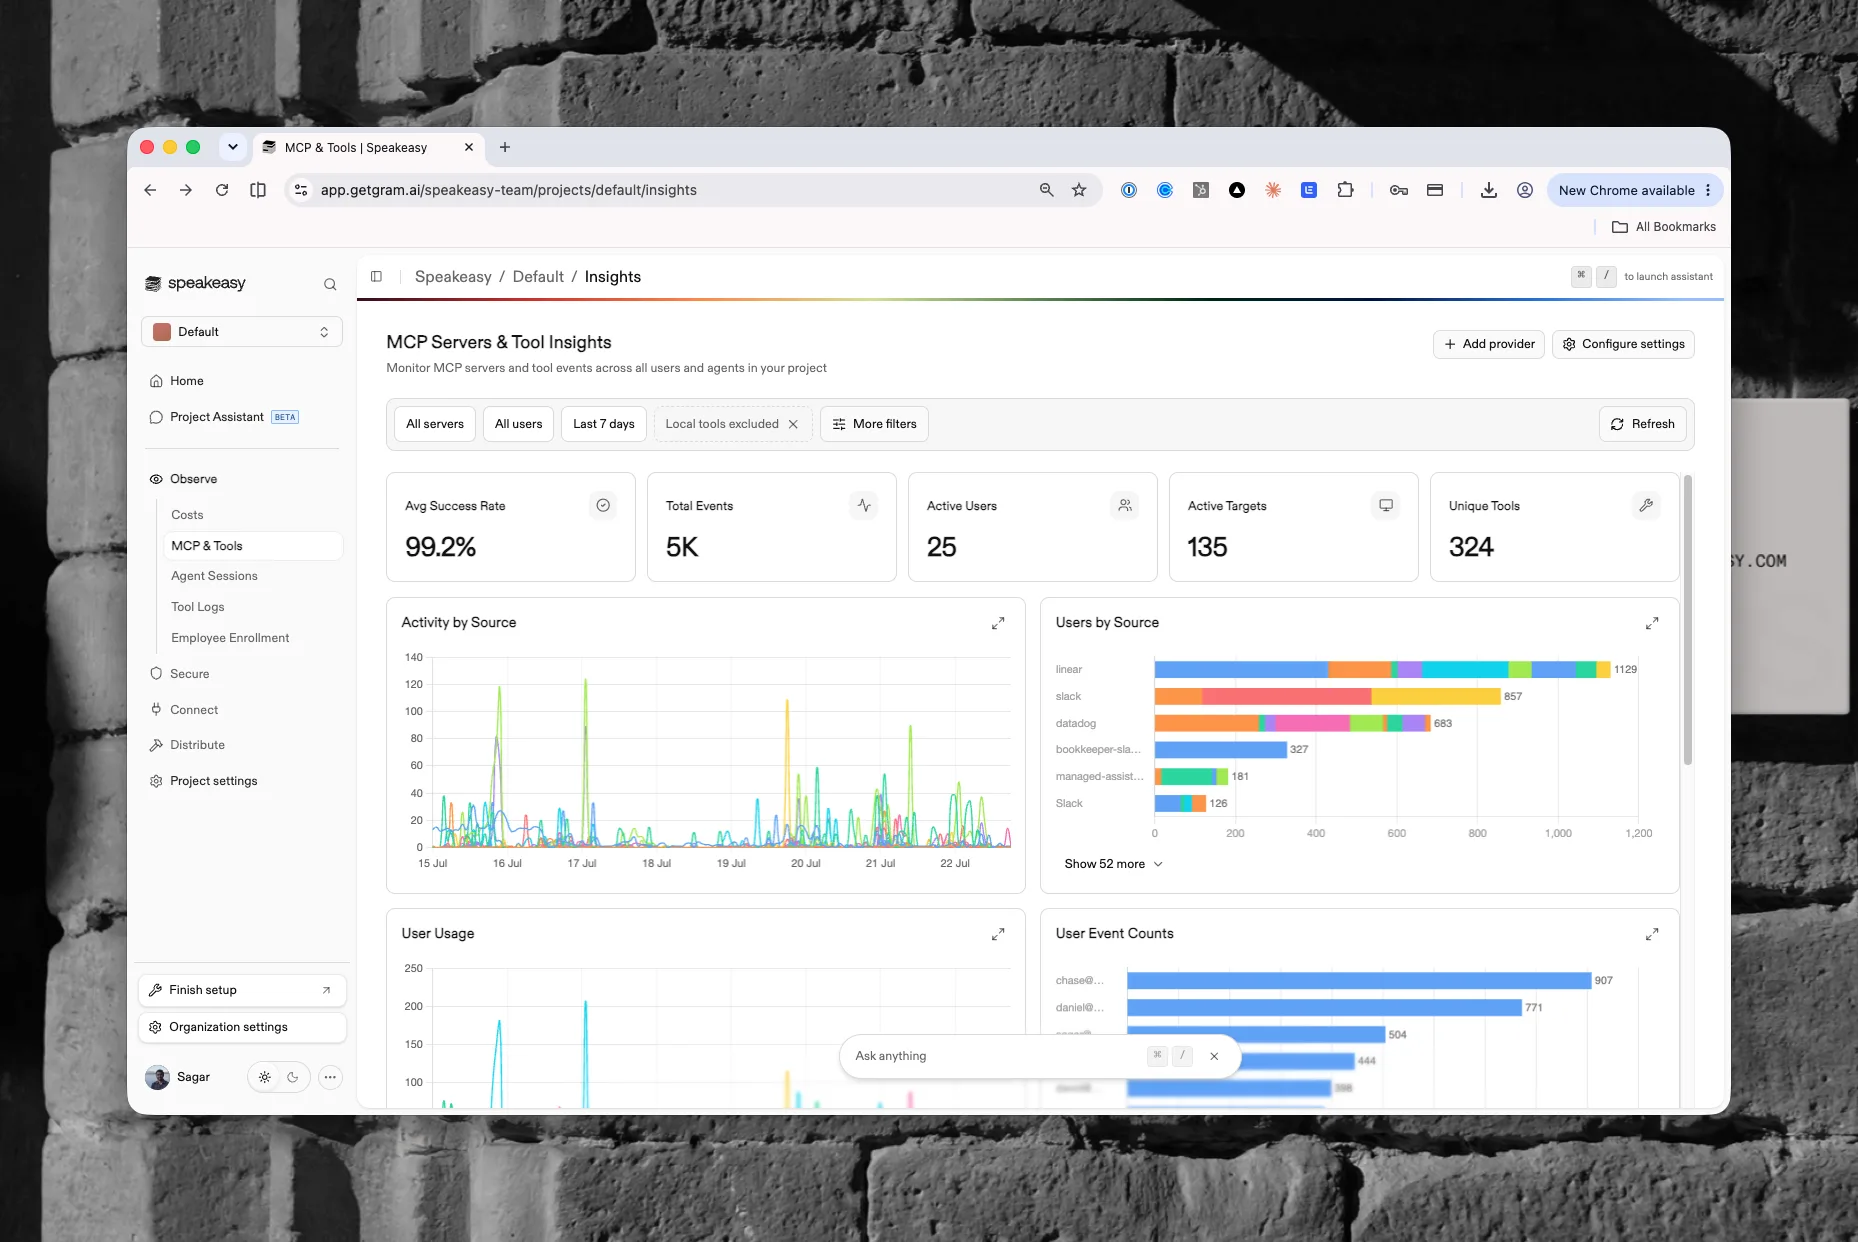
MCP Insights shows how MCP servers and tools are used across the organization. Use it to identify which servers and tools deliver value, spot where failures cluster, and watch adoption per client, skill, and person. Open it from Observability > MCP & Tools in the dashboard. Every ranked row on the board links into Tool Logs narrowed to that slice, so a question raised here is answered there without retyping the filters.
Access requirements
Section titled “Access requirements”Viewing this page requires the org:admin scope. Access is included in the default Admin role but not the Member role. For Member users, the nav entry stays visible, but opening the page shows an access-restricted notice.
Headline metrics
Section titled “Headline metrics”The top of the page summarizes the selected period:
- Tool calls counts tool call volume, with a sparkline of the window behind the number
- Failures counts failed calls, with its sparkline and the failure rate as a share of all calls beneath it
- Tools used counts distinct tools called, across however many sources served them
- People counts members generating tool activity
Each card links to Tool Logs for the same window, and Failures opens it filtered to the Error status.
Below the headline numbers, Calls over time plots call volume across the period.
Which servers and tools deliver value
Section titled “Which servers and tools deliver value”The board ranks each dimension in its own card, ordered by volume and shaded by rank so the order reads even where two bars are nearly the same length:
- Most used MCP servers shows which servers drive volume. A server with high call counts but few people serves a narrow audience; a server that many people reach is delivering value across the team
- Most used tools ranks individual tools across every server
- Most used clients ranks the MCP clients that made the calls, attributed from the name each client reports when it connects to a server. Calls the platform never saw a handshake for, such as hook-observed calls and non-MCP tool calls, are left unattributed rather than credited to a harness
- Most used skills shows how each skill is adopted
- Busiest people ranks members by their tool activity
Clicking a row drills down. The row’s server, tool, client, skill, or person becomes the filter on Tool Logs, carrying the page’s date range and other filters along, so the view moves from an aggregate to the individual calls behind it without rebuilding the query. Dragging on the Calls over time chart re-scopes the page’s date range to the selected region.
Spotting and investigating failures
Section titled “Spotting and investigating failures”The Failures headline number shows how many calls failed or were blocked in the period, and the Most errors card ranks the tools responsible, showing only tools with recorded failures.
To investigate a failure cluster, start with Calls over time to find when volume changed, move to Most errors to see which tool is responsible, then click through to the pre-filtered Tool Logs view to inspect individual calls and their error output. Failure counts include calls blocked by policy as well as runtime errors, so a spike can indicate policy enforcement at work rather than a broken tool.
Filters
Section titled “Filters”The filter bar narrows every card on the page. Filter by server, user email, agent, role, account type, status, and date range. The Type filter distinguishes Hosted MCP Servers, Tunneled MCP Servers, Gateways, Shadow MCP Servers, Local Tools, and Skills, which is useful for watching adoption of sanctioned servers versus shadow or local usage. Gateways appear by name in the server filter, and tool usage can be split by the MCP client that made each call, using the client name reported at the MCP handshake; calls with no handshake are grouped as unattributed. See Gateways. The AI-assistant mode answers questions about server and tool usage in natural language.
Empty state
Section titled “Empty state”Before any data arrives, the page shows an Install Observability plugin prompt with setup flows for Claude Code, Claude Cowork, Codex, Cursor, opencode, and Pi. Once agents report activity, the board populates automatically. If existing filters match nothing, the page suggests adjusting the search query or time range.