Security and Policy / Watchdog
Watchdog
Triage the riskiest AI usage in the organization: ranked risk signals with redacted evidence, one-time suppression, and one-click exclusion rules.
The Watchdog page is the triage surface for risk findings. Guardrail policies record a finding for every match in an agent session. Watchdog clusters related findings into signals and ranks them by severity. A signal groups findings that share a root cause, such as one detection rule firing repeatedly for the same team. Triaging a short list of ranked signals is faster than reading thousands of raw findings. Open the page from Security and Policy > Watchdog in the dashboard.
Access requirements
Section titled “Access requirements”Viewing this page requires the org:admin scope. Watchdog is enabled per organization; where it is not yet enabled, the Security and Policy group shows the former Risk Overview page in its place.
This page covers the triage loop, in order:
The raw finding-level log lives on Risk Events. Watchdog replaces the former Risk Overview page, and old Risk Overview links redirect here.
Reading the dashboard
Section titled “Reading the dashboard”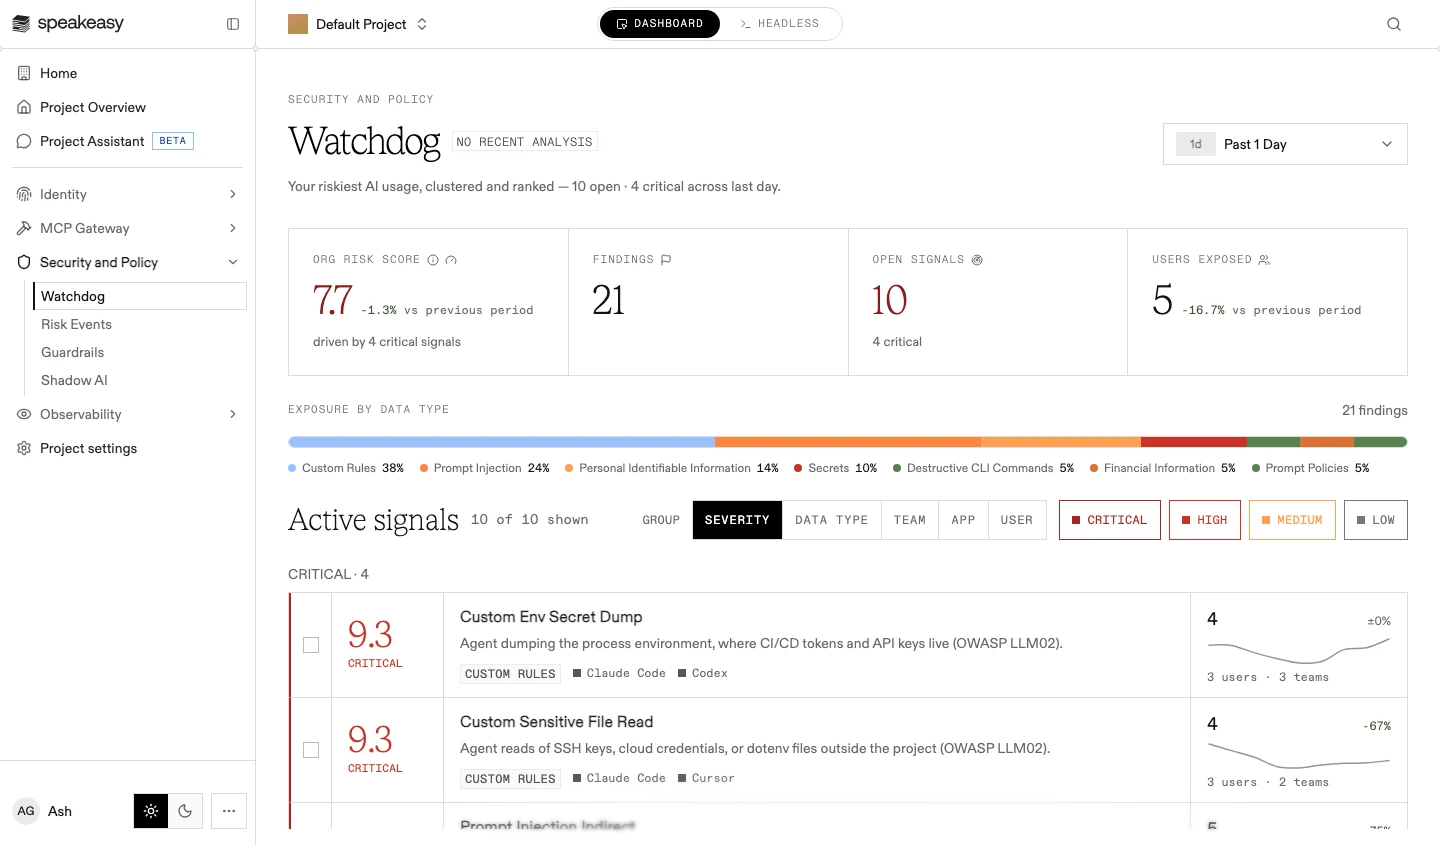
Set the time range with the picker above the cards.
A status badge beside the page title reports when risk analysis last ran. It reads Analyzing now while a run is in flight, Last analyzed with the relative time once the run is idle (with the outcome appended when the last run did not finish normally, and the absolute time in a tooltip), or No recent analysis when no run is visible. Analysis is signal-driven rather than scheduled: it wakes within about 30 seconds of new session traffic, so an empty signal list beside a recent analysis time means nothing was found rather than nothing was checked.
Four headline cards compare the selected time range against the previous period:
- Org risk score: a weighted score of open risk, driven up by critical signals. Each signal inherits its score from its policy, and the overall score weights the most severe signal, the average of the top signals, and the total number of findings rather than taking a plain average
- Findings: detection rule matches in the range
- Open signals: active signal clusters, with a count of how many are critical
- Users exposed: users whose sessions produced findings
The exposure bar breaks findings down by data type, such as secrets or PII. Each slice is also a filter: select a data type to narrow the signal list, and select it again to clear.
The Active signals list contains every open signal in the range. Each row shows the signal’s severity score, the rule behind it, the apps it was observed in, a trend sparkline, and the count of affected users and teams. Group the list by Severity, Data type, Team, App, or User, and filter by severity level. Grouping by User ranks the people behind the findings; a person’s identity page gathers their findings alongside their sessions, devices, and access.
Investigating a signal
Section titled “Investigating a signal”-
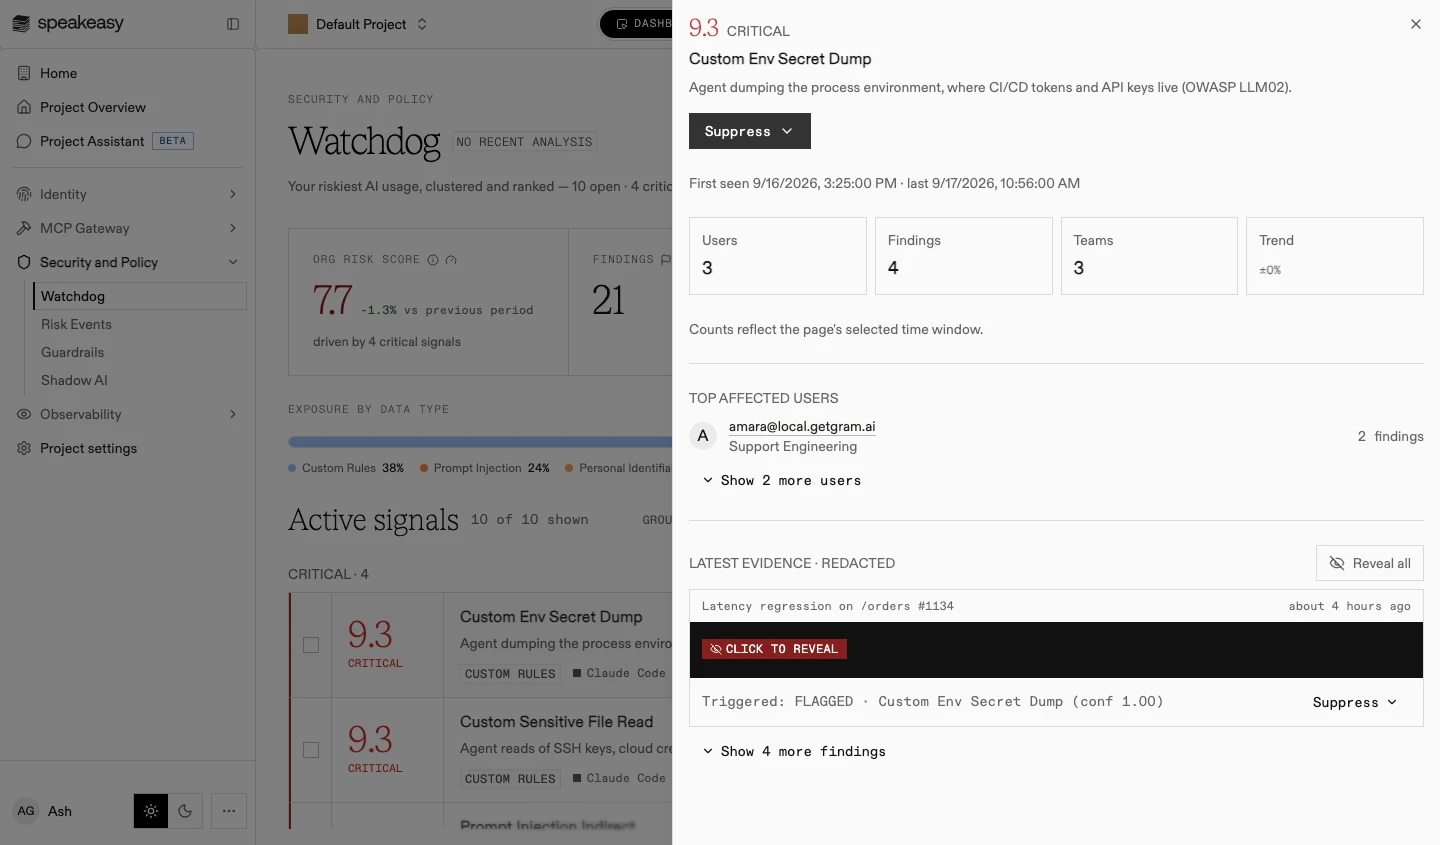
Select a signal in the Active signals list. The signal drawer opens.
-
Review the evidence. Matched content is redacted by default: select Click to reveal on a match to reveal it in place, or Reveal all above the evidence list to reveal every match.
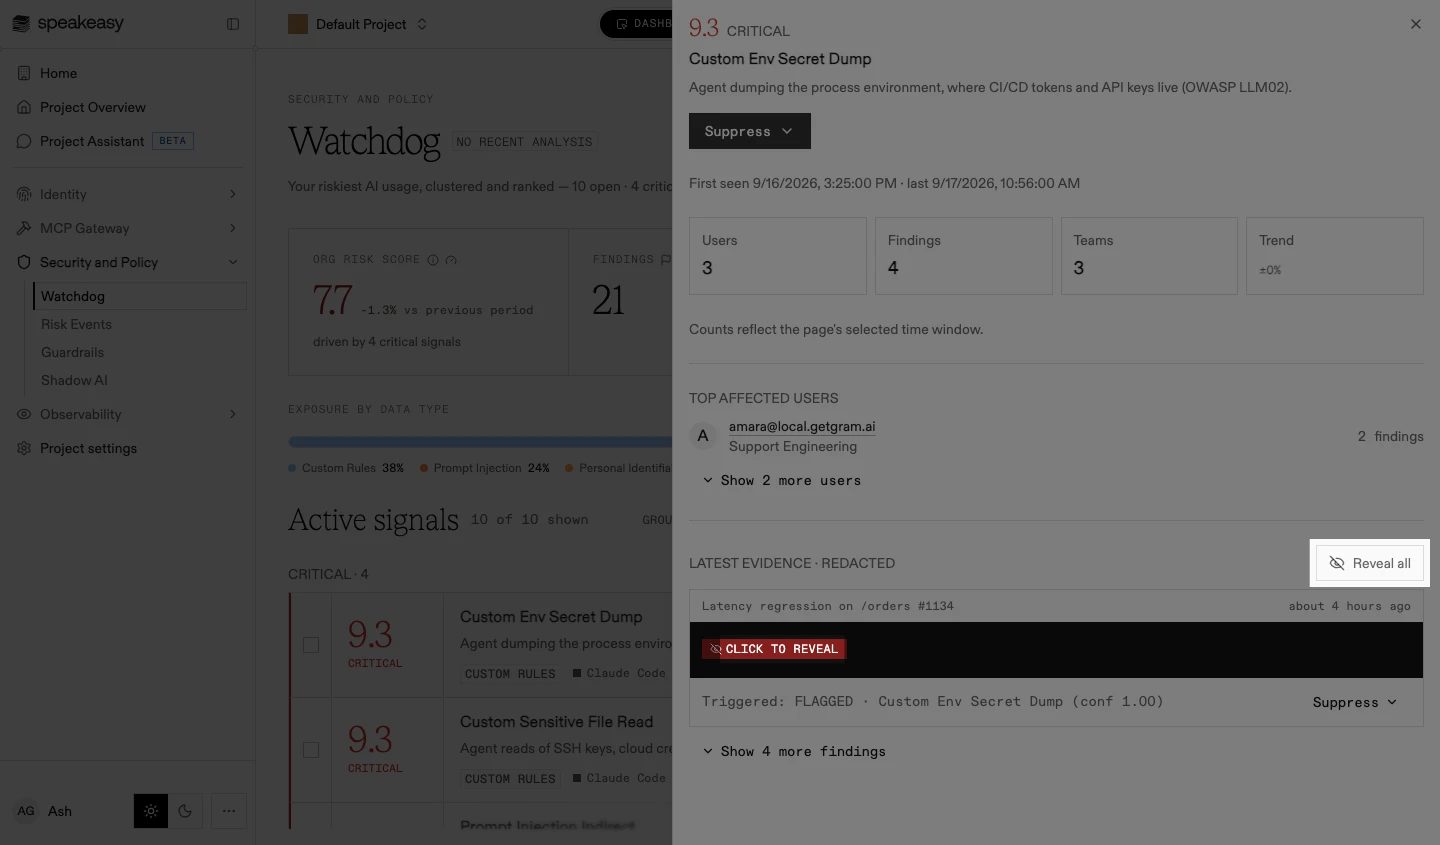
Every reveal is recorded in the audit log.
The drawer’s regions, top to bottom:
- The header shows the severity, the rule description, and the signal’s first and last occurrence.
- Summary cards count the affected users, findings, and teams, with the trend for the window.
- Top affected users lists who triggered the findings and how often.
- Evidence lists the findings, each with its message context and the rule that matched.
Findings from prompt-based policies show the judge’s rationale in place of a redacted match, so their evidence carries no reveal controls. To investigate a single finding across its full session, use Risk Events, the finding-level log.
Resolving signals
Section titled “Resolving signals”-
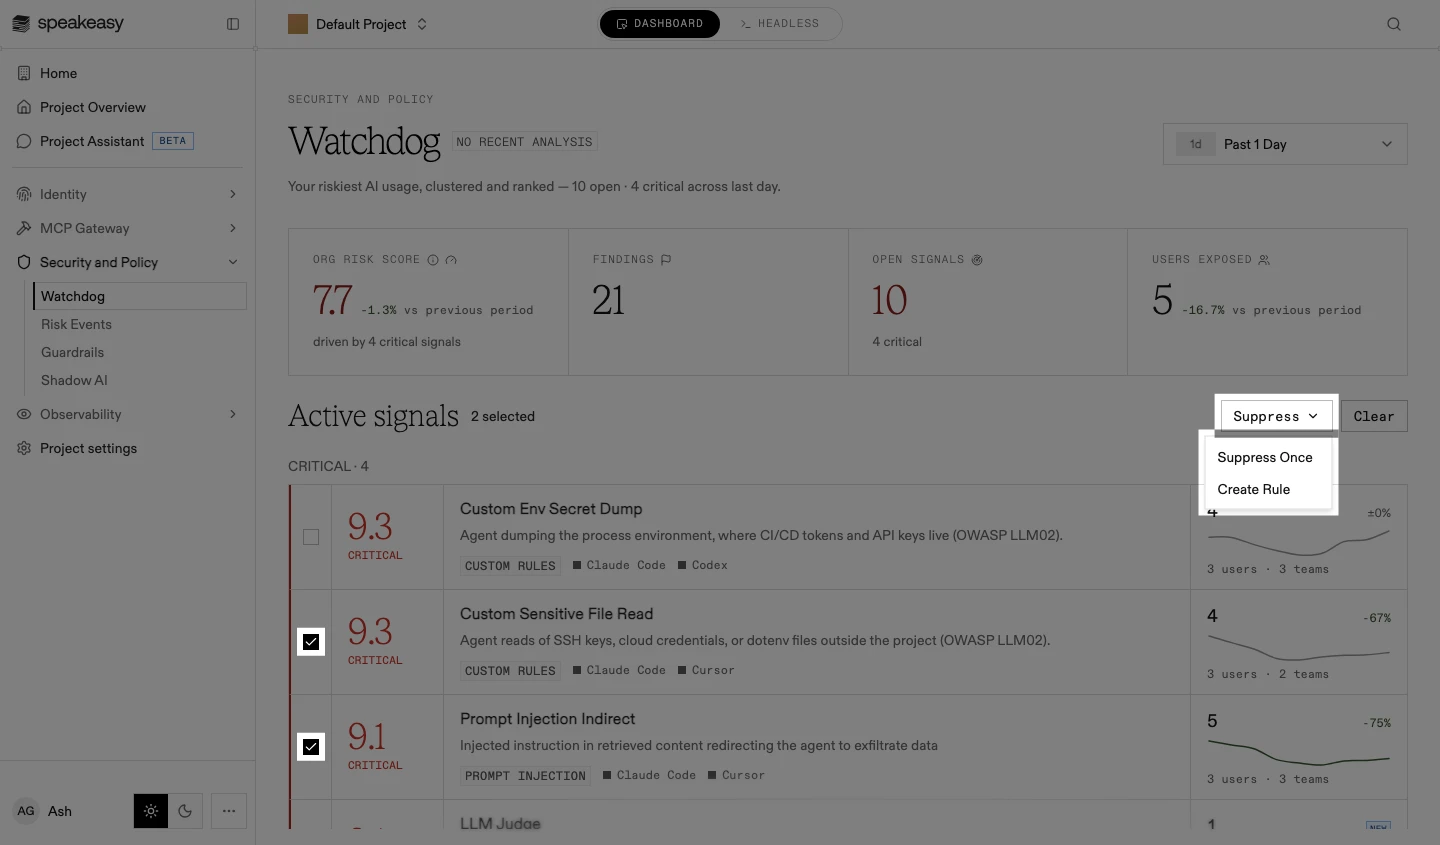
Select one or more signals with the checkboxes in the Active signals list, then open the Suppress menu.
-
Choose the action:
- Suppress Once: dismisses the selected findings from the active list, the score, and the headline counts. It changes no policy, and a suppressed finding can be restored. Use it for noise that is not expected to recur
- Create Rule: creates an exclusion rule from the selection, suppressing its findings retroactively and going forward. Use it for false positives that recur. The rule criteria prefill from the signal
The drawer suppresses a single signal with the same menu.
The Suppressed section below the active list holds everything the signal clusters no longer count, excluded from the score and the headline counts. Each row shows why: a manually suppressed finding offers Restore, and a rule-suppressed finding offers View rule.
Findings from prompt-based policies carry a judged verdict rather than a reproducible match, so tune those policies through the guardrail and its detection scope rather than value-based exclusions.
For signals that reflect real risk, remediation happens outside Watchdog: rotate the exposed credential, block the server, restrict the person with a killswitch, or tighten role grants. To stop the behavior rather than report it, raise the policy’s action from flag to deny or quarantine.