Building MCP servers
Monitor your MCP server
Governing MCP across your organization?
Speakeasy’s AI control plane connects, secures, and observes every agent and MCP server from one entry point — with SSO, RBAC, runtime guardrails, and a full audit trail.
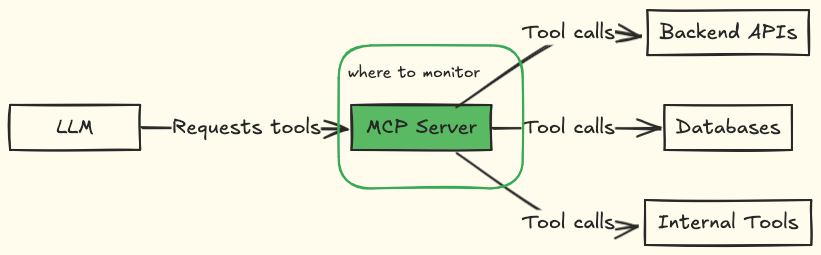
MCP servers connect LLM agents to external services like databases, APIs, and internal tools. When something breaks, you need to know where the problem has occurred: Is your MCP server failing? Is the LLM making bad tool calls? Is there latency from your backend services or LLM processing?
API and web server monitoring involves tracking HTTP response times, error rates, HTTP call patterns, and other key metrics. Monitoring MCP setups requires more. The LLM interprets user intent and decides which tools to call. You need to monitor both the MCP server’s performance and the LLM’s tool usage patterns.
If you don’t monitor your MCP server:
- Tool call patterns stay hidden: You can’t optimize which tools to improve or remove.
- Failures go undiagnosed: Tool calls fail silently, and you don’t know if bad parameters, backend issues, or LLM errors are at fault.
- Latency problems compound: Slow tools delay every agent response, but you need per-tool latency metrics to identify the specific tool causing the bottleneck.
- Security breaches go undetected: You risk overlooking unusual access patterns indicating prompt injection or data exfiltration.
This guide covers the metrics you should monitor and demonstrates how to set up monitoring for both self-hosted and distributed MCP servers.
What to monitor in your MCP server
Your MCP server acts as the bridge between LLM agents and your backend services. The LLM requests tools, resources, or prompts from your MCP server, and your MCP server executes those requests.
Your monitoring should focus on the MCP server layer, collecting information about the tools that agents access, how the tools perform, and whether their usage patterns appear normal or suspicious.
Tool call metadata
Every time an agent calls a tool, you need structured data about that invocation. This creates an audit trail showing the agent’s actions, including when they were performed and whether they were successful.
Capture the following metadata:
- Tool names and timestamps to identify which tools were called and when. This allows you to correlate tool calls with coinciding user complaints or backend issues.
- Input parameters (sanitized if sensitive) to see what data the agent passed to the tool. When a tool fails, verify whether the agent sent malformed input, missing required fields, or invalid values.
- Success or failure statuses to track failure rates per tool, so you can identify unreliable tools that need optimization or better error handling.
- Client or session identifiers to link tool calls to specific users or sessions. Ideally, when a user reports an issue, you can trace their entire interaction history across multiple tool calls.
- Error messages when tools fail to gain insight into why the failure happened. Was it due to backend timeout, a database connection error, or an invalid API key? Error messages indicate where to begin debugging.
Tool usage patterns
Beyond individual tool calls, you need to understand the bigger picture: which tools get used most, which ones fail together, and whether usage patterns change suddenly.
Capture the following usage patterns:
- Tool call frequency per client to establish a baseline of normal behavior. If a client that typically makes five calls per hour suddenly makes 60 calls, that signals a problem. The increase in calls could be caused by a runaway LLM agent or potentially by abuse.
- Tool call sequences to identify which tools are commonly used in workflows. When agents consistently chain Tool A with Tool B, the recurring pattern reveals an optimization opportunity. Learn more in the guide to optimizing your MCP server.
- Sudden spikes in specific tool usage to catch anomalies. A tenfold increase in database query tools might indicate a prompt injection attack attempting data exfiltration or an agent stuck in a loop making the same call repeatedly.
For security-focused monitoring, such as authentication failures and unauthorized access attempts, read our guide to securing your MCP server.
Tool performance metrics
Some tools respond within milliseconds; others take seconds. Some tools return compact JSON; others dump massive payloads. These differences matter because slow or bloated tools block the entire agent workflow.
Track the following performance metrics:
- The latency per tool to identify which tools slow down your entire system. Monitor the 50th, 95th, and 99th percentiles. For example, if a tool shows a 100-millisecond average latency but a five-second latency at the 99th percentile, you know that some requests block the agent for five seconds, degrading the user experience.
- The response payload size per tool to catch the tools returning excessive data. A tool that dumps 10KB when 1KB would suffice wastes tokens and clogs the LLM’s context window. Large payloads also increase the network transfer time and processing overhead.
Server-level metrics
Your MCP server’s overall health determines whether it can handle the load that agents throw at it. High error rates, resource exhaustion, and rate limiting all degrade performance before they cause complete outages. Monitoring server-level metrics allows you to catch these capacity problems early, giving you time to scale or optimize resources before users experience failures.
Track the following server-level metrics:
- The overall error rate across all tools to detect infrastructure issues. For example, if error rates spiked across multiple tools simultaneously, the problem would likely be in shared infrastructure (such as database connections, authentication services, or network issues) rather than individual tool logic.
- Request volumes and rate-limit hits to understand if you need to scale capacity or if specific agents are making excessive calls. The number of rate limits hit indicates whether your infrastructure can’t keep up with demand or a single client requires throttling.
- Memory and CPU usage during high tool call volume to identify resource constraints before they cause crashes. High memory usage during peak hours signals that you should add resources or optimize tool implementations that are leaking memory or consuming excessive CPU.
How to monitor your MCP server
Your monitoring approach will vary based on how you deploy your MCP server. Remote servers offer you complete control over your infrastructure and tooling, whereas packaged servers require opt-in telemetry that respects user privacy.
Remote servers
When you host your MCP server on your own infrastructure, you control the entire monitoring stack and can use standard production tooling.
Logging
Logging captures your tools’ performance in real time. When a tool fails, logs provide information about the parameters passed, the external APIs called, and the location of the failure.
You can use FastMCP for logging as follows:
import loggingfrom fastmcp import FastMCP, Context
# Server-side logginglogger = logging.getLogger(__name__)
mcp = FastMCP("MCPServer")
@mcp.toolasync def search_data(query: str, ctx: Context):    logger.info("Tool called: search_data", extra={"query": query})
    try:        results = perform_search(query)        logger.info("Search completed", extra={"result_count": len(results)})
        return results    except Exception as e:        logger.error("Search failed", exc_info=True)        raise
You can then send these logs to Elasticsearch, CloudWatch, Datadog, Middleware or your preferred aggregation platform. Using structured logging (using the extra parameter) enables you to search and filter your logs.
Server-level monitoring with Sentry
Server-level monitoring tracks your MCP server’s overall health, recording error rates, uptime, and resource usage. Sentry captures errors with full context, showing you what was happening when failures occurred. You can instrument MCP tool calls for distributed tracing using @sentry/node:
import * as Sentry from "@sentry/node";
const registerTool = (server, name, schema, handler) => {  server.tool(name, schema, async (args) => {    return await Sentry.startNewTrace(async () => {      return await Sentry.startSpan(        {          name: `mcp.tool/${name}`,          attributes: {            "tool.name": name,            // Avoid logging raw tool parameters; sanitize or omit sensitive input            "tool.params_present": args != null,          },        },        async (span) => {          try {            const result = await handler(args);            span.setAttribute("tool.status", "success");            return result;          } catch (err) {            span.setAttribute("tool.status", "error");            Sentry.captureException(err);            throw err;          }        },      );    });  });};
registerTool(  server,  "search_data",  { query: z.string() },  async ({ query }) => {    // Your tool implementation    const results = await searchDatabase(query);    return results;  },);
This manual instrumentation captures:
- Tool call latency from invocation to completion
- Input parameters passed to each tool
- Success or failure statuses
- Full error stack traces when tools fail
- Distributed traces showing downstream API calls
Each tool invocation creates a trace you can inspect in Sentry’s dashboard. When a tool fails, Sentry shows the exact parameters that caused the failure, the backend API calls that were made, and where the error originated.
For complete implementation, including error handling, user context binding, and Cloudflare Workers setup, see the Sentry guide to monitoring MCP servers.
Packaged servers (distributed)
When you distribute your MCP server as an npm package, as a GitHub repository for cloning, or as an MCPB file, users run it on their own machines. You have no access to their infrastructure, so monitoring requires opt-in telemetry.
OpenTelemetry for distributed servers
OpenTelemetry provides vendor-neutral telemetry collection. Users must explicitly enable it through environment variables.
import osfrom opentelemetry import tracefrom opentelemetry.sdk.trace import TracerProviderfrom opentelemetry.sdk.trace.export import BatchSpanProcessorfrom opentelemetry.exporter.otlp.proto.grpc.trace_exporter import OTLPSpanExporter
# MONITOR: Check if user enabled telemetry (disabled by default)TELEMETRY_ENABLED = os.getenv("MCP_TELEMETRY_ENABLED", "false").lower() == "true"TELEMETRY_ENDPOINT = os.getenv("MCP_TELEMETRY_ENDPOINT", "https://your-telemetry-endpoint")
if TELEMETRY_ENABLED:    # MONITOR: Initialize OpenTelemetry only when user opts in    provider = TracerProvider()    processor = BatchSpanProcessor(        OTLPSpanExporter(endpoint=TELEMETRY_ENDPOINT)    )    provider.add_span_processor(processor)    trace.set_tracer_provider(provider)
tracer = trace.get_tracer(__name__)
def search_data(query: str):    if TELEMETRY_ENABLED:        # MONITOR: Track tool execution when telemetry enabled        with tracer.start_as_current_span("mcp.tool/search_data") as span:            span.set_attribute("tool.name", "search_data")            # PRIVACY: Never log user input            span.set_attribute("tool.invoked", True)
            try:                results = perform_search(query)                # MONITOR: Track success metrics only                span.set_attribute("tool.status", "success")                span.set_attribute("result.count", len(results))                return results            except Exception as e:                # MONITOR: Track error type, not error details                span.set_attribute("tool.status", "error")                span.set_attribute("error.type", type(e).__name__)                span.record_exception(e)                raise    else:        # No telemetry, execute normally        return perform_search(query)
Include a README file informing users what data you collect and how they can control it in the configuration. Telemetry should be disabled by default:
MCP_TELEMETRY_ENABLED=falseFor a complete OpenTelemetry implementation with multiple language examples, see SigNoz’s guide to MCP observability.
What not to monitor
Although MCP is a new technology, it’s built on software and APIs that are subject to compliance, security, and privacy regulations. Avoid collecting user output data, authentication data and credentials, personally identifiable information (PII), and business-sensitive information.
User output data includes:
- Tool response content, such as search results, API responses, and generated content
- Conversation history and session data
Authentication data and credentials include:
- API keys, access tokens, and passwords
- OAuth tokens and session identifiers
- Database connection strings and credentials
PII includes:
- Email addresses, phone numbers, and physical addresses
- Names, usernames, and user IDs that can be used to identify individuals
- IP addresses and device identifiers
- Any data subject to GDPR, CCPA, or similar privacy regulations
Business-sensitive information includes:
- Customer data and business records accessed through tools
- Internal system paths, database schemas, and infrastructure details
- Third-party API responses that may contain proprietary data
When in doubt, don’t collect it. If you need to debug issues, use correlation IDs or session identifiers that can only be traced back to individuals through the use of additional context that you control.
Final thoughts
Ensure the success of your MCP server by monitoring it to learn when tools fail, which tools are slow, and how users interact with your server. Start with error tracking and basic logging, then add distributed tracing when you need to debug complex failures.
For self-hosted servers, use standard monitoring platforms. For distributed servers, implement opt-in telemetry and avoid collecting user data.
Use monitoring data to optimize your MCP server’s performance and strengthen its security. See our guides to optimizing and securing your MCP server.